Research Article
Optimization of Alkaline Hydrogen Peroxide Conditions for Preparing High Soluble Apple Pomace Dietary Fiber with response Surface Methodology
Institute Agro-products Processing Science and Technology, Chinese Academy of Agricultural Sciences, PR China
*Corresponding author: Yi-Ming Ha, Professor, Institute Agro-products Processing Science and Technology, Chinese Academy of Agricultural Sciences, PR China, Tel: +86010-62815971, Fax: +86010-62829727, E-mail: hayiming@sina.com
Received: November 29, 2016 Accepted: December 6, 2016 Published: March 8, 2017
Citation: Guo Q, Geng YW, Jin J, Li QP, Ha YM. Optimization of Alkaline Hydrogen Peroxide Conditions for Preparing High Soluble Apple Pomace Dietary Fiber with response Surface Methodology. Madridge J Food Technol. 2017; 2(1): 57-63. doi: 10.18689/mjft-1000109
Copyright: © 2017 The Author(s). This work is licensed under a Creative Commons Attribution 4.0 International License, which permits unrestricted use, distribution, and reproduction in any medium, provided the original work is properly cited.
Abstract
The optimization of alkaline hydrogen peroxide (AHP) conditions for preparing high soluble apple pomace dietary fiber (APDF) was studied using a Box-Benhnken design. The effects of pH, H2O2 concentration, temperature and time on the APDF yield and soluble dietary fiber (SDF) contents were systematically investigated by response surface methodology. Analysis of variance showed that a second-order polynomial equation could be used to predict the experimental data (R2>0.94). The APDF yield and SDF content were significantly affected by pH and temperature. The optimum conditions maximizing the APDF yield and SDF contents were: pH=11.30, H2O2 concentration=1 g.100 mL-1, temperature=80°C and time=1 h. Under these conditions, the recorded response values for APDF yield was 760.0 g.kg-1 and for SDF content was 302.0 g.kg-1, respectively. The swelling capacity and color of prepared APDF were significantly improved.
Keywords: Optimization; Apple pomace; Soluble dietary fiber; Alkaline hydrogen peroxide; Response surface methodology.
Introduction
Apple pomace (AP) is one of the main by-products generated during apple juice processing. A vast amount of AP (~1.8 million tons) is produced every year in China. However, most of the AP is either used as animal feed and fertilizer or discarded as industry waste that is not fully utilized and poses potential environmental hazards [1,2]. AP contains abundant nutritional substance, such as pectin, poly phenol and minerals [3]. In particular, AP is an excellent source of dietary fiber, constituting over 60% of the dry AP [4].
Dietary fiber is generally classified as soluble dietary fiber (SDF) and insoluble dietary fiber (IDF). SDF appears to be superior to IDF in improving physiological outcomes and technological performance [5]. Evidence suggests that SDF has the capability to increase viscosity, improve gut health, reduce the glycemic response and plasma cholesterol, and prevent cardiovascular disease and cancer [6,7]. Additionally, SDF has improved technological applications over IDF for gel formation and emulsification in food industry. However, the content of SDF in AP is very low. Thus, to improve the usefulness of AP, it is essential to produce high soluble apple pomace dietary fiber (APDF).
Several physical and enzyme approaches, such as twin-screw extrusion technology, micronization technology and xylanase hydrolysis, have been applied to improve the solubility of dietary fiber in different agricultural by-products [8-11]. However, these techniques are expensive and require special equipment. Alkaline hydrogen peroxide (AHP) treatment is a simple and low cost method, which has been used to prepare dietary fiber powders from cereal and fruit by-products [12,13]. It exhibits better effect on removing lignin and improving the physical properties of the byproducts compared to other methods [12]. Moreover, hydrogen peroxide has been removed completely by degrading into oxygen and water during the treatment [14]. The solubility of hemicellulose in cell wall has been promoted by AHP treatment [15]. However, little research has been done to increase the SDF content of AP by AHP treatment.
The purpose of this study was to optimize the preparation conditions of APDF by AHP treatment to reach the maximum yield of APDF. The independent variables include inlet pH, H2O2 concentration, treatment temperature, and treatment time. The APDF yield and SDF content, which are important parameters of APDF and can be affected significantly by the independent variables, were chosen as evaluation parameters. The chemical composition and physicochemical properties of prepared APDF by AHP treatment were also evaluated.
Materials and Methods
Materials
Dried AP (Gala, Fuji, and Starking apples were mixed) was obtained from China Haisheng Fresh Fruit Juice Co. Ltd. The samples were crushed into a powder using a sample mill (Tecator Cyclotec 1093, FOSS, Sweden) and passed through a 60-mesh sieve. The 30% hydrogen peroxide, sodium hydroxide (NaOH), hydrochloric acid (HCl), ethanol and acetone were obtained from Sinopharm Chemical Reagent Beijing Co., Ltd (Beijing, China).
APDF preparation by AHP treatment
AHP solution was prepared as described previously by the method of Pourfarzad et al. [5]. Different concentrations of hydrogen peroxide solutions were prepared and the pH was adjusted with 4 mol.L-1 NaOH. Then, AP was treated with AHP solution at a ratio of 1:20 (w/v, g.mL-1). The sample was then incubated in a water bath at a certain temperature for a period of time. After neutralization with 6 mol. L-1 HCl, 95% ethanol was added to the solution to precipitate APDF for 2 h, where the ratio of ethanol volume to sample volume was 4:1. The precipitation was collected with a filter, and dried in an air-oven at 60°C for 12 h. The APDF was then crushed into powder and passed through a 60-mesh sieve.
Determination of APDF yield
2 g of AP was added to 40 mL of AHP solution. The APDF was prepared according to the above stated method. The APDF yield was calculated using the equation:

Where W1 is AP mass and W2 is APDF mass.
Determination of SDF
0.5 g of APDF sample was suspended in 20 mL of water and incubated for 2 h at 60°C. To separate the SDF and IDF, the suspension liquid was then centrifuged using a high speed refrigerated bench-top centrifuge (Neofuge 15R, Heal Force, Hong Kong, China) for 15 min at 9000 rpm. To obtain SDF, the supernatant was precipitated with four volumes of 95% ethanol for 2 h, and filtered through a filtering crucible (G2). The SDF residue was then washed twice with 15 mL 78% ethanol, 95% ethanol and acetone. The SDF was dried, weighed and the SDF content was calculated as weight of SDF residue minus the protein and ash, using the following equation:

Where R1, R2 and R3 are SDF residue masses; S1, S2 and S3 are APDF masses; P is protein mass and A is ash mass.
Experimental design and statistical analysis
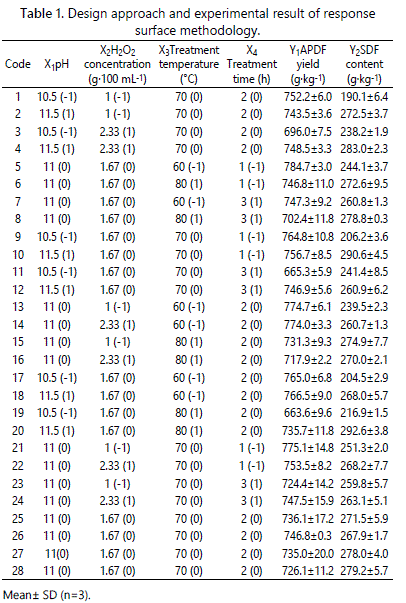
The pH (X1: 10.5, 11 and 12), H2O2 concentration (X2: 1g 100 mL-1, 1.67 g . 100 mL-1 and 2.33 g . 100 mL-1), treatment temperature (X3: 60°C, 70°C and 80°C) and treatment time (X4: 1 h, 2 h and 3 h) were selected as the independent variables. Response surface methodology (RSM) was used for modeling and analyzing of the optimization process. The experimental design employed in the experiment was a Box- Benhnken design which consisted of 24 runs and four replicates of the central point for the estimation of pure error (Table 1). The response variables were APDF yield (Y1) and SDF content (Y2). All the experiments were carried out in a random order to minimize the effect of unexplained variability in the observed responses due to systematic errors [16]. The experimental results were fit to the following second-order polynomial model:

Where Y is the response variable, β0, βi, βii, and βij are the regression coefficients of variables for constant, linear, quadratic, and interaction regression terms, respectively, and Xi and Xj are the independent variables. The analysis of variance (ANOVA) was applied to validate the significance of the models, the lack of fit, and each regression coefficient. The R2 value, adjusted R2 value and coefficient of variation (C.V.) were also calculated.
Analysis of chemical composition
The moisture, lipid, protein, ash, total dietary fiber (TDF), SDF and IDF contents in AP and prepared APDF were analyzed. To determine the contribution of vapor content, a moisture test apparatus (MA 100, Sartorius, Germany) was used. The lipid was determined gravimetrically by extraction with petroleum ether using a Soxhlet apparatus (SER 148, VelpScientifica, Italy) (AOAC method 920.39). The protein was measured using a KjeldahlAzotometer (Kjeltec 2300, FOSS, Denmark), where the factor used for converting nitrogen content to crude protein content was 6.25 (AOAC method 955.04). The ash was analyzed by igniting the sample in a muffle furnace set (Lindberg/ Blue, Thermo Fisher, America) at 550°C for 5 h (AOAC method 923.03). TDF, IDF and SDF were determined by the non-enzymatic-gravimetric method (AOAC method 993.21). The total starch content of AP had been determined to be less than 2%.
Analysis of physicochemical properties
The physicochemical properties of APDF including water holding capacity (WHC), oil holding capacity (OHC), swelling capacity (SC) and color were measured and evaluated.
WHC and OHC were measured by the method described by Mei et al. [17] with slight modifications. 0.5 g samples were weighed and added into 50 mL centrifuge tubes. Then 30 mL of distilled water was added to each sample, and the tubes were vortexed to disperse the samples. After standing for 18 h at room temperature, the samples were centrifuged at 9000 rpm for 15 min. The supernatant was removed and the samples were weighed again. The WHC was calculated as the amount of water held by 1 g of sample. Similarly, 0.2 g samples were incubated with 1.5 g of corn oil in a 10 mL centrifuge tube. Other steps were in accordance with standard methods of determining WHC. The OHC was calculated as the amount of oil held by 1 g of sample.
SC was determined using the bed volume technique as described previously [18]. The samples were placed in graduated conical tubes, and the bottom of the tubes was gently tapped until the volume of the samples was stabilized at 0.2 mL. Approximately 10 mL of distilled water was added to each sample and mixed thoroughly. After 18 h, the swelling volume was recorded. The SC was calculated as the volume swelled by 1 g of sample.
Color analysis was done according to the method of El-Kadiri et al. [19]. using a colorimeter (Chroma Meter CR-300, Minolta Co., Japan).The CIE L*a*b* color model was used for determination of the color of AP and APDF. The three parameters of interest were: L*, which represents the lightness of color (0=black; 100=white); a*, which represents red (a*>0) and green (a*<0); and b*, which represents yellow (b*>0) and blue (b*<0).
Results and Discussion
Construction of the model
In the present study, the effects of independent factors (X1, X2, X3, and X4) on the responses of prepared APDF by AHP treatment were analyzed using RSM. The design and responses of each experiment were shown in table 1. Yield is an important index for evaluation of the method. The yield of the prepared APDF varied from 663.6 g.kg-1to 784.7g.kg-1, with the corresponding SDF content in the prepared APDF ranging from 190.1 g.kg-1 to 290.6 g.kg-1. To examine the effects of the conditions on the APDF yield and SDF content, a second-order polynomial model (4) and (5) were obtained by multiple regression analyses as follows:
Y1 = 736.0 + 15.9X1 – 5.3X2 – 26.2X3 – 20.6X4 + 15.3X1X2 + 17.7X1X3 + 22.4X1X4 – 3.2X2X3 + 11.2X2X4 – 1.7X3X4 – 8.4X12 + 8.3X22 + 4.7X32 + 5.4X42(4)
Y2 =274.1 + 30.9X1 + 7.9X2 + 10.7X3 + 2.7X4 – 9.4X1X2 + 3.1X1X3 – 16.2X1X4 – 6.5X2X3 – 3.4X2X4 – 2.6X3X4 – 21.0X12 – 7.7X22 – 6.2X32 – 4.4X42(5)
Where X1, X2, X3 and X4 are the pH, H2O2 concentration (g. 100 mL-1), treatment temperature (°C), and treatment time (h), respectively, while Y1 is the yield of APDF (g. kg-1), and Y2 is the content of SDF (g.kg-1).
Analysis of variance (ANOVA)
ANOVA was used to analyze the significance and accuracy of the quadratic models. From table 2, the ANOVA results showed that the obtained second-degree polynomial model (4) was extremely significant (P<0.0001) for APDF yield with a satisfactory determination coefficient (R2=0.9423), suggesting that this model can accurately explain the relationship between the independent variables and the response. The adjusted determination coefficient (Adj R2=0.8802) was also high, indicating the high accuracy of this model. Meanwhile, the lack of fit (P=0.3748>0.05) of this model was not significant. The value of the coefficient of variation (C.V.) was 1.40%, less than 5%, indicating that the quadratic polynomial model was reproducible. Thus, the model was accurate for predicting the APDF yield by AHP treatment. The P-values were used to reflect whether a regression coefficient is significant. The smaller the P-value, the more significant the coefficient is [9]. The regression coefficient analysis indicated that the linear coefficients (X1, X3, X4) were very significant (P<0.01). Treatment temperature had the most significant effect on APDF yield, followed by treatment time and pH. The interaction terms X1X3 and X1X4 were extremely significant (P<0.01), and the interaction term X1X2 was significant (P<0.05). However, the H2O2 concentration, quadratic terms and other terms had no significant effects on APDF yield (P>0.05).

The ANOVA results for the SDF content of prepared APDF are shown in table 3. The regression model (5) was highly significant (P< 0.0001), and the lack of fit (P = 0.3331 > 0.05) was not significant. The R2 value of the model indicated that 96.69% of the behavior of the SDF content could be explained by this model. The Adj.R2 was 0.9313 and the C.V. was 2.68%, both confirming that the model could be used to accurately predict the SDF content of prepared APDF by AHP treatment.
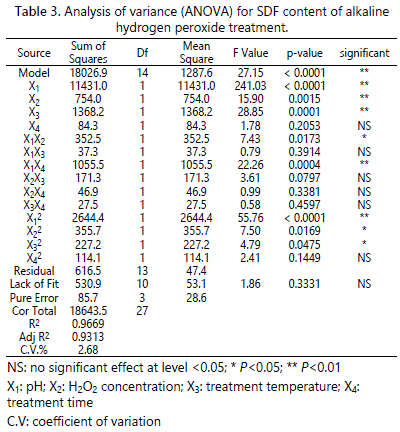
Table 3 also showed that coefficients significantly affected the SDF content. The model revealed that pH was the most significant factor affecting the SDF content, followed by treatment temperature and H2O2 concentration. The treatment time was not significantly related to the SDF content. The interaction term X1X4 and the quadratic term X12 were extremely significant (P<0.01), and the X1X2, X22 and X32 were also significant (P<0.05). However, the other terms were not significant (P>0.05).
Effect of interaction on APDF yield
According to the results of the ANOVA shown in Table 2, the interactions of X1X2, X1X3, and X1X4 were all significant (P<0.05). Previous study showed that the best way of visually expressing the effect of variables on the responses within the experimental space was to generate response surface plots of the model [16]. The response surfaces for the effects of variables on the APDF yield are shown in figure 1. The APDF yield decreased with the increase of H2O2 concentration, treatment temperature and treatment time at pH of 10.5 (Figure 1a). This reduction was attributed to the changes of the reaction conditions resulting in the decomposition of the dry matter [20]. When the H2O2 concentration, pH, treatment temperature, treatment time were at higher levels, the APDF yield increased with the increase in pH (Figures 1a-1c). That is probably because the increases in pH would increase the salt content in the AHP system, offsetting the dry matter decomposition and increasing the yield. Interestingly, no significant effects of H2O2 concentration, treatment temperature and treatment time on the APDF yield were observed at pH of 11.5.
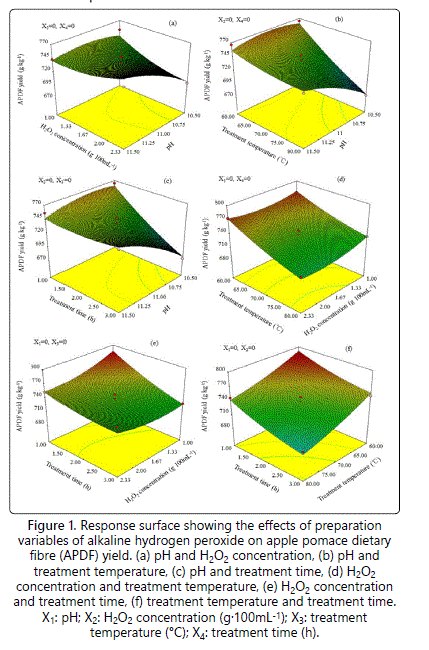
The interactions of X2X3, X2X4, and X3X4 are shown in figures 1d-1f at pH of 11. In each of the response surface plots, the maximum yield of APDF was obtained when both of the variables were at -1. This is related to the weakest reaction conditions. The results further confirmed that APDF yield decreased with the gradual increase of H2O2 concentration, treatment temperature and treatment time, and no significant interactions were observed between them. The optimum condition for the maximum yield of APDF was found to be at a pH of 10.83, a H2O2 concentration of 1.23 g.100 mL-1, a treatment temperature of 60.16°C and a treatment time of 1.04 h. Under this condition, the APDF yield was 811.0 g.kg-1.
Effect of interaction on SDF content
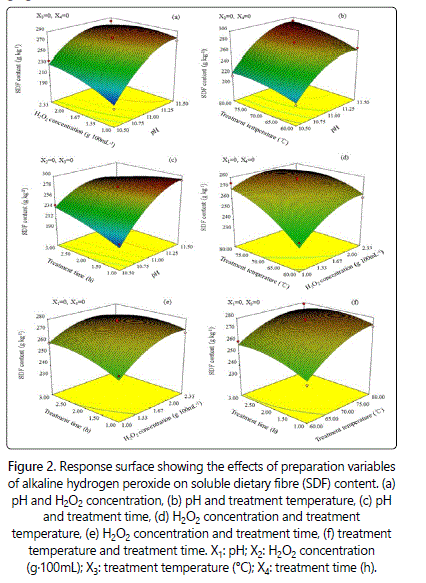
As shown in figure 2a, the content of SDF increased with the increase of pH and H2O2 concentration. When the pH remained constant at 10.5, the content of SDF increased from 190.1g.kg-1 to 272.5g. kg-1 when H2O2 concentration increased from 1% to 2.33%. Li et al [21]. showed that the solubilization of hemicelluloses increased with increase in H2O2 concentration in alkali-treated rice straw. The improvement of SDF content with increasing H2O2 concentration may be attributed to the generation of reactive hydroxyl radicals such as ·OH and O2- [22]. The hydroxyl radicals can attack the molecular chain, thus destrupt the structure of cellulose, resulting in the degradation of hemicellulose. When the H2O2 concentration remained constant at 1 g.100 mL-1, the content of SDF increased about 43.34% at the pH ranged from 10.5 (190.1 g.kg-1) to 11.5 (272.5 g.kg-1). However, the SDF content declined after the pH and H2O2 concentration increased to a certain level. This is likely related to the increased levels of free radicals, which accelerated the breakage of polysaccharidesʼ glucosidic bonds to degrade into low molecular weight sugars.
Figure 2b shows that the content of SDF increased with the increase in treatment temperature, similar to the results of Doner and Hicks [23]. Who reported that increased temperatures contributed to the extraction of hemicellulose B by AHP. These results indicated that higher temperatures may accelerate the decomposition of H2O2 to further increase the solubility and diffusion of SDF. However, the effect of treatment temperature on the content of SDF was less significant than that of pH. The content of SDF in the prepared APDF increased with extended treatment time at lower level of pH (Figure 2c). However, the content of SDF at pH of 11.5 decreased with the increase of treatment time (Figure 2d). The content of SDF increased with the increase of H2O2 concentration when the treatment temperature (Figure 2d) and time (Figure 2e) were at lower levels. However, the content of SDF increased, and then decreased with the treatment temperature (Figure 2d) and time (Figure 2e) when H2O2 concentration was at higher level. The effect of treatment temperature on the content of SDF was more significant than that of treatment time (Figure 2f). These result indicated that a stronger reaction condition had negative influence on the increase of SDF content in APDF. In the present study, the optimum condition for the maximum of SDF content was found as: pH of 10.51, H2O2 concentration of 1.19 g.100 mL-1, treatment temperature of 69.48°C and treatment time of 1.13 h. Under these conditions, the SDF content was 185.14 g.kg-1.
Optimization of conditions and verification of results
pH, H2O2 concentration, treatment temperature and treatment time were optimized simultaneously through a desirability function which would satisfy all the responses with requirements to obtain optimum preparation conditions. The ultimate aim was to obtain the highest APDF yield and SDF content. In the present study, the predicted optimal conditions were obtained at pH of 11.34, H2O2 concentration of 1 g. 100 mL-1, treatment temperature of 79.96°C and treatment time of 1h. An experiment was carried out to confirm the adequacy of the models at pH of 11.30, H2O2 concentration of 1g. 100 mL-1, treatment temperature of 80°C and treatment time of 1h. The results showed that the experimental values of APDF yield and SDF content were 760.0 ± 3.3 g. kg-1 and 302.0 ± 7.2 g. kg-1, respectively, while the predicted values of them were 764.8 g. kg-1 and 289.7 g. kg-1, respectively. Although the APDF yield slightly decreased, using multi-objective optimization approach compared to that of single objective optimization, yet SDF content improved about 56.5%. In the present study, the optimal value of pH is 11.3, close to the value reported by Gould [22], who showed that pH 11.5 was the optimum pH for the dissociation reaction of H2O2. It was indicated that the optimum pH in our study for preparation APDF had the lowest residual of H2O2.
The experimental values for multi-objective optimization were in perfect agreement with the predicted values with less than 1% error, indicating that the RSM model was valid and adequate for describing the preparation process. Hence, the optimum conditions for preparation of high soluble APDF by AHP treatment were as follows: pH was 11.30, H2O2 concentration was 1 g.100 mL-1, treatment temperature was 80°C and treatment time was 1 h. Under these conditions, the response values were APDF yield of 760.0 ± 3.3 g.kg-1, and SDF content of 302.0 ± 7.2 g.kg-1, respectively.
The composition and physicochemical properties of prepared APDF
The main chemical composition and physicochemical properties of APDF are shown in table 4. The amount of moisture in prepared APDF decreased about 44.5% while the amount of ash increased about 373.2% compared to those in AP. The increase in ash may be due to the addition of sodium hydroxide, which confirmed the relation between APDF yield and pH. No significant changes were observed in protein content. The contents of TDF and SDF in prepared APDF by AHP treatment were 1.18 and 9.15 folds higher than those in AP, respectively. The increase in SDF content by AHP treatment is significantly higher than that by extrusion modification, microwave-assisted acid extraction and xylanase enzyme treatment [24,25], suggesting that the method of AHP treatment is effective for preparing APDF with a high content of SDF. The content of IDF decreased with the increase of SDF in prepared APDF, indicating that a part of IDF transformed into SDF during the AHP treatment.
The swelling capacity (SC) of AP has been improved by 94.4% in the prepared APDF. The increase in SC is likely related to the disruption of hydrogen bonding between cellulose chains by free radicals, and the exposed hydrophilic groups become easier to contact molecules of water [26]. The water holding capacity (WHC) and oil holding capacity (OHC) of the prepared APDF were slight higher than those of AP, consistent with the results of Sangnark and Noomhorm who found that AHP treatment improved WHC and OHC of rice straw [27]. The structure of APDF may be disrupted by AHP treatment, which increased the SDF content, and consequently reduced the porosity and capillary attraction of the fiber, thus the physical entrapment of water and oil was also reduced. The brightness L* value of AP was improved from 68.08 to 70.16, while the a* value and b* value were reduced. It was indicated that the color of prepared APDF was bleached by AHP treatment compared to AP, which increased the application scope of bleached APDF in the food industry.

Conclusion
RSM was successfully applied for estimating the effect of pH, H2O2 concentration, treatment temperature and treatment time on the APDF yield and SDF content of AP by AHP treatment. Results showed that pH and treatment temperature had an extremely significant effect on all the responses (P<0.01), and the effect of treatment temperature was the most significant on APDF yield and pH was the most significant on SDF content among the variables. The optimum conditions maximizing the APDF yield and SDF content were found as pH of 11.30, H2O2 concentration of 1 g.100 mL-1, treatment temperature of 80°C and treatment time of 1 h. Under these conditions, the response values were APDF yield of 760.0 g.kg-1and SDF content of 302.0 g.kg-1, respectively. The chemical composition and physicochemical properties were changed in the prepared APDF, especially for SDF, whose content increased about 10 folds compared to that in AP. In addition, the SC and color of AP were also improved. These results demonstrated that AHP is an effective, clean, and affordable method for preparing APDF with a high content of SDF, posing potential applications in food industry.
Acknowledgements
The authors would like to thank China Haisheng Fresh Fruit Juice Co. Ltd for providing the apple pomace. We also would like to thank the Program of Introducing International Advanced Agricultural Science and Technology of the Ministry of Agriculture of P.R. China (948 Program) (2016-X31)”, and the Special Fund for Agro-scientific Research in the Public Interest and the Research and Demonstration of Comprehensive Utilization for Bulk Fruits Processing By-products and Defect (201303076).
References
- Hanc A, Chadimova Z. Nutrient recovery from apple pomace waste by vermicomposting technology. Bioresour Technol. 2014; 168: 240-244. doi: 10.1016/j.biortech.2014.02.031
- Suarez B, Alvarez AL, Garcia YD, et al. Phenolic profiles, antioxidant activity and in vitro antiviral properties of apple pomace. Food Chem. 2010; 120(1): 339-342. doi:10.1016/j.foodchem.2009.09.073
- OʼShea N, Ktenioudaki A, Smyth TP, et al. Physicochemical assessment of two fruit by-products as functional ingredients: apple and orange pomace. J Food Engg. 2015; 153(153): 89-95. doi:10.1016/j.jfoodeng.2014.12.014
- Figuerola F, Hurtado ML, Estevez AM, Chiffelle I, Asenjo F. Fibre concentrates from apple pomace and citrus peel as potential fibre sources for food enrichment. Food Chem. 2005; 91(3): 395-401. doi: 10.1016/j.foodchem.2004.04.036
- Pourfarzad A, Mahdavian-Mehr H, Sedaghat N. Coffee silverskin as a source of dietary fiber in bread-making: Optimization of chemical treatment using response surface methodology. LWT - Food Science and Technology. 2013; 50(2): 599-606.doi:10.1016/j.lwt.2012.08.001
- Farooqui AA. Importance and Roles of Fiber in the Diet. In: High Calorie Diet and the Human Brain. Springer International Publishing. 2015; 193-218. doi:10.1007/978-3-319-15254-7_7.
- Ye C, Ran Y, Luo Y, Ning Z. Novel blasting extrusion processing improved the physicochemical properties of soluble dietary fiber from soybean residue and in vivo evaluation. J Food Engg. 2014; 120(1): 1-8. doi: 10.1016/j.jfoodeng.2013.07.011
- Li X, He X, Lv Y, He Q. Extraction and functional properties of watersoluble dietary fiber from apple pomace. J Food Engg. 2014; 37(3): 293-298.doi:10.1111/jfpe.12085
- Jing Y, Chi YJ. Effects of twin-screw extrusion on soluble dietary fibre and physicochemical properties of soybean residue. Food Chem. 2013; 138(2-3): 884-889. doi: 10.1016/j.foodchem.2012.12.003
- Petersson K, Nordlund E, Tornberg E, Eliasson AC, Buchert J. Impact of cell wall-degrading enzymes on water-holding capacity and solubility of dietary fibre in rye and wheat bran. J Sci Food Agri. 2013; 93(4): 882-889. doi: 10.1002/jsfa.5816
- Huang YL, Ma YS. The effect of extrusion processing on the physiochemical properties of extruded orange pomace. Food Chem. 2016; 192: 363-369. doi. 10.1016/j.foodchem.2015.07.039
- Rabetafika HN, Bchir B, Blecker C, Paquot M, Wathelet B. Comparative study of alkaline extraction process of hemicelluloses from pear pomace. Biomass Bioenerg. 2014; 61(2): 254-264. doi: 10.1016/j.biombioe.2013.12.022
- Feng Z, Dou W, Alaxi S, NiuY, Yu L. Modified soluble dietary fiber from black bean coats with its rheological and bile acid binding properties. Food Hydrocolloids. 2017; 62: 94-101. doi: 10.1016/j.foodhyd.2016.07.032
- Rabelo SC, Maciel FR, Costa AC. A Comparison between Lime and Alkaline Hydrogen Peroxide Pretreatments of Sugarcane Bagasse for Ethanol Production. Biotechnology for Fuels and Chemicals. Appl Biochem Biotechnol. 2008; 563-576. doi: 10.1007/s12010-008-8200-9
- Alvarez-Vasco C, Xiao Z. Alkaline hydrogen peroxide pretreatment of softwood: hemicellulose degradation pathways. Bioresour Technol. 2013; 150(3): 321-327. doi: 10.1016/j.biortech.2013.10.020
- Chen Q, Bi J, Zhou Y, et al. Multi-objective optimization of spray drying of jujube (zizyphus jujuba, miller) powder using response surface methodology. Food and Bioprocess Technology. 2014; 7(6): 1807-1818. doi: 10.1007/s11947-013-1171-z
- Mei X, Mu TH, Han JJ. Composition and physicochemical properties of dietary fiber extracted from residues of 10 varieties of sweet potato by a sieving method. J Agric Food Chem. 2010; 58(12): 7305-7310. doi: 10.1021/jf101021s
- de Escalada Pla MF, González P, Sette P, et al. Effect of processing on physico-chemical characteristics of dietary fibre concentrates obtained from peach (Prunus persica L.) peel and pulp. Food Research International. 2012; 49(1): 184-192. doi: 10.1016/j.foodres.2012.07.060
- El-Kadiri I, Khelifi M, Aider M. The effect of hydrogen peroxide bleaching of canola meal on product colour, dry matter and protein extractability and molecular weight profile. Int J Food Sci Tech. 2013; 48(5): 1071-1085. doi:10.1111/ijfs.12065
- Correia JADC, Junior JEM, Goncalves LRB, Rocha MVP. Alkaline hydrogen peroxide pretreatment of cashew apple bagasse for ethanol production: Study of parameters. Bioresour Technol. 2013; 139(7): 249-256. doi: 10.1016/j.biortech.2013.03.153
- Li X, Xu A, Xie H, et al. Preparation of low molecular weight alginate by hydrogen peroxide depolymerization for tissue engineering. Carbohydrate Polymers. 2010; 79(3): 660-664. doi: 10.1016/j.carbpol.2009.09.020
- Gould JM. Studies on the mechanism of alkaline peroxide delignification of agricultural residues. Biotechnology & Bioengineering. 1985; 27(3): 225-31. doi: 10.1002/bit.260270303
- Doner LW, Hicks KB. Isolation of hemicellulose from corn fiber by alkaline hydrogen peroxide extraction. Cereal Chemistry. 1997; 74(2): 176-181. doi: 10.1094/CCHEM.1997.74.2.176
- Sangnark A, Noomhorm A. Effect of particle sizes on functional properties of dietary fibre prepared from sugarcane bagasse. Food Chem. 2003; 80(2): 221-229. doi:10.1016/S0308-8146(02)00257-1
- Sangnark A, Noomhorm A. Chemical, physical and baking properties of dietary fiber prepared from rice straw. Food Research International. 2004; 37(1): 66-74. doi:10.1016/j.foodres.2003.09.007

