

Research Article
Descriptive Sensory analysis of Monovarietal Spanish Young Red Wines. A Comparison between Trained and Untrained Panels
Faculty of Chemical Sciences (UCLM), Area of Food Technology, University of Castilla-La Mancha, Avda. Camilo Jose Cela, Spain
*Corresponding author: Miguel Angel Gonzalez Vinas, Faculty of Chemical Sciences, Area of Food Technology, University of Castilla-La Mancha Avda. Camilo Jose Cela, Spain, Tel: 00-34-926-295300; Ext: 3426, Fax: 00-34-926-295318, E-mail: miguelangel.gonzalez@uclm.es
Received: July 26, 2018 Accepted: July 30, 2018 Published: August 4, 2018
Citation: Ferrer Valverde MA, SánchezPalomo E, González Viñas MA. Descriptive Sensory analysis of Monovarietal Spanish Young Red Wines. A Comparison between Trained and Untrained Panels. Madridge J Food Technol. 2018; 3(2): 121-125. doi: 10.18689/mjft-1000118
Copyright: © 2018 The Author(s). This work is licensed under a Creative Commons Attribution 4.0 International License, which permits unrestricted use, distribution, and reproduction in any medium, provided the original work is properly cited.
Abstract
In the wine industry, wine is often characterized by professionaltasters. Methods commonly used in descriptive sensory analysis, as “conventional profiling,” require intensive, experiment-specific trainingand thus cannot be applied by a panel of untrained tasters,even if they are wine professionals. Some spontaneous methods such as free profiling do not require time-intensive training sessions. This study compares wine sensory characterization obtained with a panel of trained judges and other with a panel of untrained judges using the free choice profiling in both case. Data were analyzed by generalized procrustes analysis. Representations provided by the twomethods are broadly similar, but reveal some disparities, although both panels are valid to evaluate the sensory characteristics of wines. Free profiling may be a good compromise to obtain meaningful results from untrained but knowledgeable wine professionals.
Keywords: Minority red grapes; Free choice profiling; Untrained panel; Trained panel; GPA.
Introduction
Knowing the sensory characteristics of food products among their competitive universe is a key priority in the food industry. To reach this objective, quantitative descriptive analysis is used to specify the nature and the intensity of the sensory characteristics perceived when a product is evaluated [1]. In industry, it represents the ideal methodology since it is known to provide detailed information and reliable and consistent results [2]. However, the use of this technique raises several questions.
Descriptive analysis is a primary tool of food sensory scientists which involves the evaluation of both the qualitative and quantitative sensory characteristics of products by a trained panel. Sensory scientists from academia and food industry have developed several descriptive methods, some of them trademarked, reflecting various philosophies of descriptive analysis. They include the Flavor Profile [3], the Texture Profile [4], Quantitative Descriptive Analysis TM [1], Sensory SpectrumTM [5], Free Choice Profiling [6], Quantitative Flavor Profiling [7] and Flash profile [8]. However, the most widely used profile technique – based on ISO NORM [9]-combines different aspects from the above mentioned methods and is generally named conventional descriptive analysis (DA).
In order to provide qualitative as well as quantitative measures of a wineʼs properties, descriptive analysis has been widely used [10-20].
Free Choice Profiling (FCP), initially applied to port [6], is an interesting tool for evaluating sensory properties of foods from the consumerʼs point of view [21,22]. As regards sensory descriptions, the language of a consumer is more global, not analytical and less accurate than the language of experts, which differs because of the exhaustive definition of the sensory attributes of a particular product [23]. FCP can easily be performed with consumers, who develop an individual vocabulary in their own, non-scientific language during judging a set of products, and who score the products by using this vocabulary; it is further assumed that the sensory character of a product is perceived similarly by the panelists, who use an idiosyncratic vocabulary [24]. As both the descriptors between individuals and the number of descriptors per assessor may differ largely, it is necessary to refer to special multivariate methods to compare different data matrices [25]. After deriving a consensus product space by Generalized Procrustes Analysis (GPA) [26], it is possible to gain information on the way how consumers differentiate between the items under study [27].
The aim of this paper was to compare the descriptive profiles generated by trained panel and by untrained panel in Spanish monovarietal young red wines.
Materials and Methods
Wines
Red wines from six cultivars grown in La Mancha region middle-southeast of Spain, harvested in their optimal ripening stage (23–24 °Brix; pH 3.4–3.6) and in good sanitary conditions, were used for winemaking. Three batches of grapes (20 kg each) of the cultivars, Rojal, Tortosí, Merlot, Moravia Agria, Moravia Dulce and Bobal, were elaborated in vats of 10 l, with skin maceration until the alcoholic fermentation finished. Winemaking conditions were: addition of 100 ppm of SO2, as K2S2O7, after stemming and crushing, inoculation with Saccharomyces cerevisiae cerevisiae selected yeasts (UCLM S325, Fould-Springer), and fermentation temperature kept at 24°C. Manual punching down was done twice a day. Separation of the wines from solids was performed when relative density reached a constant value. Subsequently, the malolactic fermentation was induced by inoculation with Oenococcus oeni lactic acid bacteria (Lactobacter SP1; Laffort); this second fermentation finished in 2–3 weeks, as confirmed by TLC, and then the wines were racked. After 1 month, the wines were racked again, filtered through 1.2 lm membranes (Millipore, Bedford, MA, USA), bottled, and stored in a conditioned room kept at 16–18°C.
Assessors
Untrained: A number of students from Food Science and Technology (University of Castilla-La Mancha) were selected. Selection criteria were availability for the assessments, interest to participate in the study, the absence of aversions, allergies or intolerance against wine, normal perception abilities, and no wine craving. After 10 sessions of 1 h a group of 11 assessors was formed (5 female, 6 male). None of the panellists had a specific training in sensory evaluation of wine, nor previous experience with FCP.
Trained: The assessors of trained panel were members of department of Food Technology of University of Castilla-La Mancha. Eight persons (5 female, 3 male) contributed to trained panel. All members had a long experience in wine sensory analysis.
Free-choice profiling
In the first of two sensory sessions, the assessors were given brief introduction into the methodology and the procedure of FCP [28]. In single sessions, they were then confronted with the seven encoded wine samples at once, asked to taste the samples and to use their individual vocabulary for describing sensory characteristics and key features related with the aroma of wines. The participants were also instructed to refer only to objective attributes and not to use hedonic terminology. Based on the descriptors used by the panelists in the preliminary session, individual score cards were prepared. These score cards were sheets of paper, labeled with the name of the assessor, with the particular descriptor, and line marking scale of a length of 10 cm [29]. Endpoints were labeled with the attributes “not perceptible” (not at all) and “clearly perceptible” (extremely). In this session (on average, 3–4 days after session 1), the samples were served monadically, and the serving order of the six samples was randomized (Fizz software).
During judgement, it was up to the assessors to eliminate the one or other descriptor if it came to their mind that it had become irrelevant, or to join two descriptors into a new one.
Statistical analysis
The data from Free Choice Profiling, i.e., the intensities of each attribute as evaluated by the assessors, were analyzed using the GPA tool in the Senstools V.3.0.11 software (OP & P Product Research BV, Utrecht, The Netherlands).
Results and Discussion
Generation of descriptors
Table 1 showed the summary of the selected descriptors produced by the assessors. The total number of different descriptors generated was higher with the untrained panel than with the trained one. According to Moskowitz [30] the experienced panellists use fewer descriptors than the novices, because it seems that the effort expended in accurate description replaces the effort used to capture all attributes however in this study the total number of descriptors used by trained panel was higher than untrained panel.
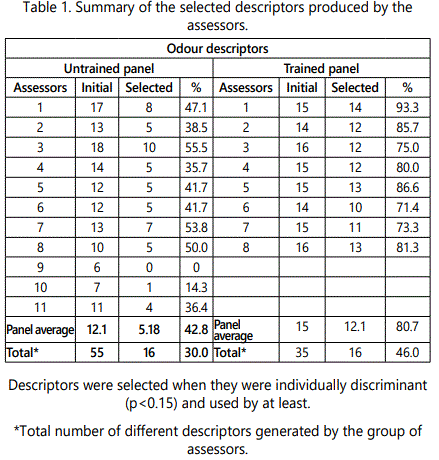
In this study the mean individual total number of different descriptors generated was similar for both panels. The higher total number of different descriptors generated by the untrained panel may be due to the higher number of assessors and their lower level of agreement and not to a greater ability in the generation of valid descriptors. In fact, the mean individual number of selected descriptors using the expert panel was more than double that of the untrained panel. The selected descriptors by expert panel were individually discriminated (P < 0.15), such as those of the untrained panel. These results were is according to the observed by [31] using the same methodology with almond.
An increase in the percentage of selected descriptors (effectiveness) represents a saving in work and time for the assessor and the analyst. The mean individual value of this percentage was higher for the expert panel than for the untrained one. The untrained assessors generally tend to use a limited, inconsistent and relatively nonspecific vocabulary to describe their perceptions [32]. This could explain the loss of effectiveness.
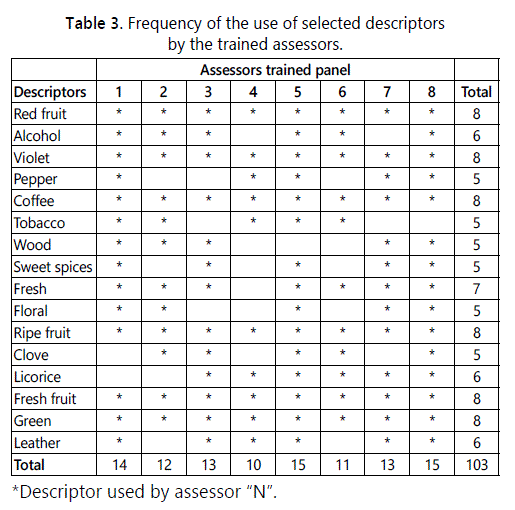
Tables 2 and 3 show the selected descriptors by assessor of each panel and the frequency of use.
The untrained assessors generally use easier but more redundant descriptors. The level of agreement among these assessors tends to be low. They presented a lower mean frequency of descriptor use, 0.31, compared to that of the expert assessors, 0.81, who after several years of joint evaluations and discussions have a higher descriptive homogeneity.
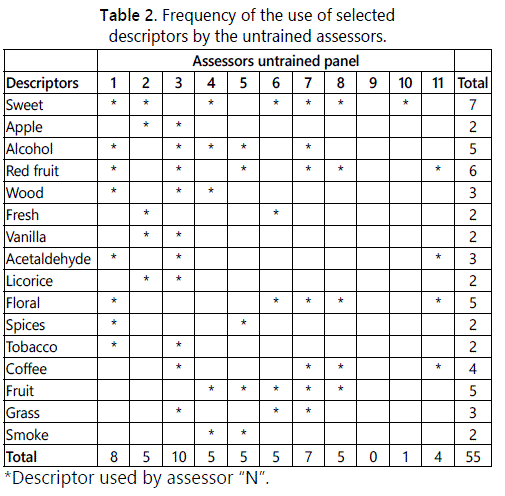
The similarities and differences in descriptors between the panels can be see in attributes listed in tables 2 and 3. The descriptors “Sweet” “Vanilla” and “Spices” from the untrained panel could be considered respectively synonymous to the expert panel descriptors: “Sweet spices”; the former being more comprehensible to the consumers. These results show the utility of profiles generated by inexpert panels [27].
The Descriptive Profile of the untrained Assessors
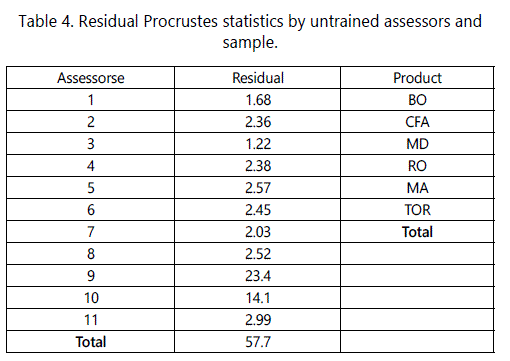
The residual Procrustes statistics by assessor and sample are shown in Table 4. The values represent the sum of square distances between individual configuration of each subject or product and the consensus configuration after Procrustes Analysis [33]. The lower the value the higher the agreement with the consensus. Only assessors 9 and 10 showed an important difference with respect to the rest of the panel. According to [34,35] this may be due to their low number of attributes (6 and 7 descriptors respectively).
The distribution of the samples in the consensus space (Figure 1) is indicative of the differences between wines. The first two dimensions explained most of the variance among the samples, with the remaining dimensions explaining only a small proportion of the variance (<6%). Dimension 1 explained 30.12% of the total variance, while dimension 2 explained 26.25%. According to these Bobal and Merlot wines were the most different, and the wines made with the rest grape varieties were grouped in two different groups, one formed by Moravía Agria and Tortosí wines and the other one by Moravia Dulce and Rojal wines.
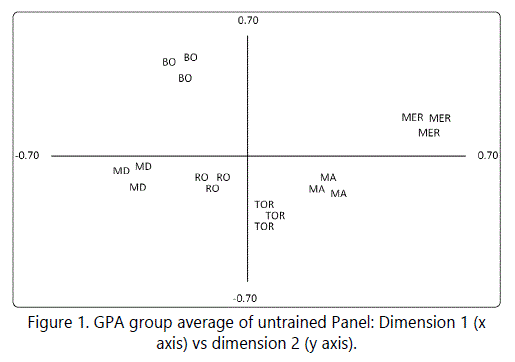
The descriptors of dimension 1 are floral, alcohol and fresh in the positive direction and sweet and coffee located in the negative direction and. The attributes more correlated with the dimension 2 are red fruit and fruity in the positive direction.
The aroma of Bobal wines were characterised by red fruit, coffee and fruity odour with sweet notes. Aroma profile of Merlot wines showed high intensity of alcohol, floral and fresh with red fruit and fruit notes. Floral, fresh and alcohol were the most important descriptor for the aroma of Moravia Agria and Tortosi wines and the aroma of Moravia Dulce and Rojal wines presented sweet and coffee notes.
Descriptive Profile of trained panel
The distribution of the samples in the consensus space (Figure 2) of trained panel is indicative of the differences between wines. The first two dimensions explained most of the variance among the samples, with the remaining dimensions explaining only a small proportion of the variance (<3%). Dimension 1 explained 31.60 %of the total variance, while dimension 2 explained 23.09%.
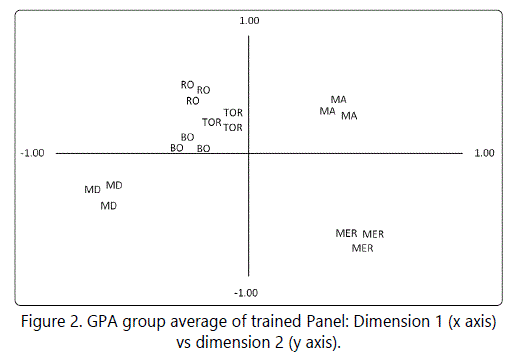
These two dimensions may be interpreted according to the content of table 5, which list the descriptors most closely correlated with both dimensions.
Moravia Agria and Merlot wines were grouped according with dimension 1 by floral and violet notes. Rojal, Tortosí, Moravia Dulce and Bobal wines were judged as red fruit, fresh, with liquorice, tobacco, coffee and sweet spice notes.
Dimension 2 explains a low percentage of variance; according to this dimension, Moravia Dulce and Merlot wines presented higher ripe fruit, wood aroma and pepper notes than the rest wines.
In descriptive profile analyses the samples are normally very different in order to allow for the generation of a high number of descriptors [36,37]. The product by assessor interaction was not significant (P > 0.05) in any descriptor [38], which indicates a high level of agreement among the assessors [1]. The assessor and session effects were not significant either (P > 0 .05).
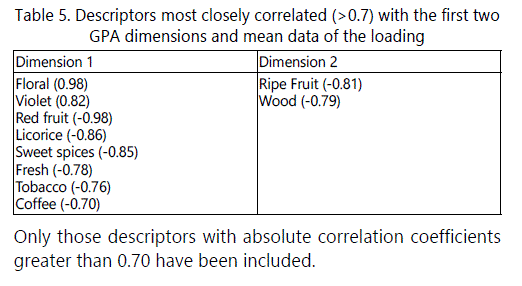
Only those descriptors with absolute correlation coefficients greater than 0.70 have been included.
Conclusion
The Free Choice Profiling with untrained assessors reduces the main problems associated with the QDA analysis in reference to the time consumption in training and adjustment of an expert panel, and produces descriptors which are simple and easy to understand, and can be used to describe the characteristics of a product with several complexity as wine. Untrained assessors are capable to generate a similar number of descriptors to the expert assessors, though they showed a lower efficacy in the generation of descriptors. In general the untrained assessors used less specific and sometimes redundant descriptors. Profiles obtained by both panels are similar in an overall sense when the samples are clearly different, though only the expert assessors are able to discriminate.
References
- Stone H, Sidel J, Oliver S, Woolsey A, Singleton RC. Sensory evaluation by quantitative descriptive analysis. Food Technology. 1974; 28: 24-34. doi: 10.1002/9780470385036.ch1c
- Rodriguez N, Guillet M, Fortin J, Martin JF. Comparing information obtained from ranking and descriptive tests of four sweet corn products. Food Qual Prefer. 2000; 11(1-2): 47-54. doi: 10.1016/S0950-3293(99)00063-4
- Szczesniak AS. Objective measurements of food texture. J Food Sci. 1963; 28(4): 410-420. doi: 10.1111/j.1365-2621.1963.tb00219.x
- Williams AA, Langron SP. The use of free-choice profiling for the evaluation of commercial ports. J Agric Food Chem. 1984; 35(5): 558-568. doi: 10.1002/jsfa.2740350513
- Heymann H, Noble AC. Comparison of Canonical Variate and Principal Component Analysis of wine descriptive analysis data. J Food Sci. 1989; 54(5): 1355-1358. doi: 10.1111/j.1365-2621.1989.tb05991.x
- Andrews JC, Durvasula S, Akhter SH. A framework for conceptualizing and measuring the involvement construct in advertising research. J Advert Res. 1990; 19(4): 27-40. doi: 10.2307/4188777
- Carlucci A, Monteleone E. Statistical validation of sensory data: a study on wine. J Sci Food Agric. 2001; 81(8): 751-758. doi: 10.1002/jsfa.879
- Koussissi E, Paterson A, Cristovam E. Sensory discrimination of dry red wines from Greece. Aust J Grape Wine Res. 2002; 13: 165-179. doi: 10.1080/0957126022000018007
- Koussissi E, Paterson A, Piggott JR. Sensory flavour discrimination of Greek dry red wines. J Sci Food Agric. 2003; 83(8): 797-808. doi: 10.1002/jsfa.1414
- Varela P, Gámbaro A. Sensory descriptive analysis of uruguayan Tannat Wine: correlation to quality assessment. J Sens Studies. 2006; 21(2): 203-217. doi: 10.1111/j.1745-459X.2006.00061.x
- Parr WV, Green JA, White KG, Sherlock RR. The distinctive flavor of New Zealand Sauvignon blanc: Sensory characterization by wine professionals. Food Qual Prefer. 2007; 18(6): 849-861. doi: 10.1016/j.foodqual.2007.02.001
- Delarue J, Sieffermann JM. Sensory mapping using Flash profile. Comparison with a conventional descriptive method for the evaluation of the flavour of fruit dairy products. Food Qual Prefer. 2004; 15(4): 383-392. doi: 10.1016/S0950-3293(03)00085-5
- Sune F, Lacroix P, Huon de Kermadec H. A comparison of sensory attribute use by children and experts to evaluate chocolate. Food Qual Prefer. 2002; 13(7-8): 545-553. doi: 10.1016/S0950-3293(02)00057-5
- Narain C, Paterson A, Reid E. Free choice and conventional profiling of black filter coffee to explore consumer perceptions of character. Food Qual Prefer. 2003; 15(1): 31-41. doi: 10.1016/S0950-3293(03)00020-X
- Jack FR, Piggott JR. Free choice profiling in consumer research. Food Qual Prefer. 1992; 3(3): 129-134. doi: 10.1016/0950-3293(91)90048-J
- Deliza D, Macfie H, Hedderley D. The consumer sensory perception of passion-fruit juice using free-choice profiling. J Sens Stud. 2005; 20(1): 17-27. doi: 10.1111/j.1745-459X.2005.050604.x
- Piggott JR, Sheen MR, Apostolidou SG. Consumersʼ perceptions of whiskies and other alcoholic beverages. Food Qual Prefer. 1990; 2(3): 177-185. doi: 10.1016/0950-3293(90)90022-M
- Johnsen PB, Civille GV, Vercellotti JR, Sanders HT, Dus CA. Development of a lexicon for the description of peanut flavor. J Sens Stud. 1988; 3: 9-17. doi: 10.1111/j.1745-459X.1988.tb00426.x
- Prell PA, Sawyer FM. Consumer evaluation of the Sensory Properties of Fish. J Food Sci. 1988; 53(1): 12-18. doi: 10.1111/j.1365-2621.1988.tb10166.x
- Thamke I, Dürrschmid K, Rohma H. Sensory description of dark chocolates by consumers Food. Sci Tech. 2009; 42(2): 534-539. doi: 10.1016/j.lwt.2008.07.006
