

Research Article
Morpho-Anthropological characteristic of the distribution of Adipose Connective Tissue in Elderly Bulgarian Males with Type 2 Diabetes Mellitus
Department of Anatomy, Histology and Embryology, Faculty of Medicine, Medical University-Plovdiv, Bulgaria
*Corresponding author: Atanas Baltadjiev, Associate Professor, Department of Anatomy, Histology and Embryology, Faculty of Medicine, Medical University of Plovdiv, 15A Vassil Aprilov Blvd, 4002 Plovdiv, Bulgaria, Tel: +359886359609, E-mail: dr_atanas@abv.bg
Received: May 16, 2018 Accepted: June 4, 2018 Published: June 9, 2018
Citation: Baltadjiev AG. Morpho-Anthropological characteristic of the distribution of Adipose Connective Tissue in Elderly Bulgarian Males with Type 2 Diabetes Mellitus. Madridge J Diabetes. 2018; 2(1): 42-46. doi: 10.18689/mjd-1000108
Copyright: © 2018 The Author(s). This work is licensed under a Creative Commons Attribution 4.0 International License, which permits unrestricted use, distribution, and reproduction in any medium, provided the original work is properly cited.
Abstract
Background: Diabetes is becoming a rapidly growing health concern across the world
due to rapidly growing number of patients. Obesity and type 2 Diabetes Mellitus (T2DM)
are closely related.
The aim of this study was to investigate the distribution of adipose connective tissue
in elderly Bulgarian male patients with T2DM.
Patients and Methods: Subjects of the research were 97 men suffering from T2DM, with age range 60-80 years. The control group included 40 Bulgarian healthy men in the same age range. Directly measured parameters: body height, body weight, 9 skinfolds (sf) and Bioelectrical Impedance analysis. Calculated indexes: Body mass index (BMI), the ratio sfTrunk/sfLimbs, the ratio skin folds upper half of body/skin folds lower half of body, fat mass and subcutaneous fat mass.
Results: Statistically significant differences were found among the means of body weight, sfXrib, sfThigh, BMI, % body fat tissue, visceral fat tissue, fat mass and subcutaneous fat mass between the diabetic and healthy men. The body composition of elderly male patients with diabetes contained a significant larger adipose component than the controls. The well expressed visceral adipose tissue which determines the body composition is a reliable indicator of the health risks in elderly patients with T2DM.
Conclusion: In male patients with T2DM aged 60-80 years the model of subcutaneous adipose tissue distribution was predominant in the upper torso region and less in the limbs. The common fat tissue and visceral adipose tissue in male patients were significantly more expressed than the healthy controls. These data revealed a worse anthropological status of the body composition in male patients with T2DM.
Keywords: Type 2 diabetes mellitus; Elderly males; Adipose tissue; Skinfolds.
Introduction
Type 2 Diabetes mellitus (T2DM) is a metabolic disease associated with disturbance of the metabolism. In recent years, it is gaining more signs of social problem due to the rapidly growing number of people affected by the disease worldwide. As of 2015, it was estimated that 415 million people had diabetes worldwide, with type 2 DM making about 90% of those cases. This represents 8.3% of the adult population, with equal rates in both women and men. According to the International Diabetes Federation, the number of diabetes mellitus patients in Europe is expected to increase from 52 millions in 2014 to 68.9 millions by 2035, mostly due to increases in overweight and obesity, unhealthy diet and physical inactivity [1]. According to WHO this is about 10.3% of men and 9.6% of women aged 25 years and over (Today's Market Study of Diabetes, https://www.diabetesexpo.com/ europe/). Across Europe, about 1 in 11 adults is affected and this number is set to rise as the population ages. In Bulgaria around 8-9% of the population suffers from this disease.
Most of the researchers are interested in etiology, pathogenesis, clinical course and treatment of the disease. The anthropological status of patients with diabetes takes little attention. The fat accumulation in the body of patients with diabetes occurs primarily in two locations: in the abdomen (central, abdominal, visceral) and subcutaneously (peripheral). Fat accumulation in the abdominal area is commonly associated with increased risk for T2DM [2, 3, 4, 5]. Not many studies have been performed for the subcutaneous distribution of adipose connective tissue. World literature offers little data on the complex deposition of adipose connective tissue in patients with T2DM. The purpose of this study was to investigate the distribution of adipose tissue in 61-80 years old Bulgarian male patients with T2DM.
Subjects and Methods
137 men were enrolled in the study. Subjects of the study were 97 men with T2DM and 40 healthy men (controls). They were diagnosed by a diabetes specialist and recruited from the Clinic of endocrinology of St.George University Hospital at the Medical University of Plovdiv, Bulgaria. The study period was 2009-2014.
The inclusion criteria were: Bulgarian ethnicity, duration of the disease of not less five years, clinically compensated diabetes at the time of the study, age range 60-80 years (mean 68.75±0.58 SEM yrs). The control group included 40 men at the same age range (mean 69.76±0.90 SEM yrs).
The exclusion criteria were: previous or existing metabolic, oncological and other disorder that could compromise the anthropological study: thyroid related diseases, adrenal glands related diseases, cancer etc. The anthropological methods included:
Directly measured parameters
Body height and body weight, skinfold (sf) thicknesses
were measured at 9 locations-sfTriceps, sfBiceps (brachii),
sfForearm, sfSubscapular, sfXrib, sfAbdomen, sfSuprailiaca,
sfThigh, and sfCalf, using Harpenden Skinfold Calipers (British
Indicators Ltd) at standard sites on the right side of the body.
Bioelectrical Impedance Analysis (BIA)
-% body fat tissue and visceral fat tissue - was measured
with a Body Composition Monitor Tanita.BC-532.
Calculated Indexes
Body mass index (BMI); sfTrunk/sfLimbs ratio; skinfolds
upper half of body/skinfolds lower half of body ratio; fat mass
and subcutaneous fat mass.
Statistical Analysis
Data were analyzed using statistical software SPSS version
15 (SPSS Inc., Chicago, IL). Parametric statistical methods
were relevant. Independent Samples t Test was used to
compare the means of two independent anthropologic
parameters in order to determine whether there was
statistical evidence that the means were significantly
different. The one-way analysis of variance (ANOVA) was
used to determine whether there were any significant
differences between the means of three or more
independent parameters. P<0.05 (two tailed) was considered
statistically significant. We used Pearson's correlation to
assess associations between variables, and Pearson's
correlations coefficient (PC) was calculated. The value of the
coefficient was used to rate the correlation's strength: low
correlation - 0.01-0.30; moderate - 0.30-0.50; strong 0.50-0.70; high - 0.70-0.90; very high >0.90. P<0.05 (two tailed) was
considered statistically significant.
Results
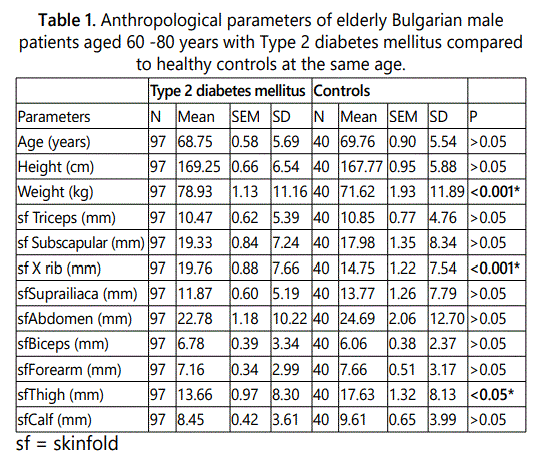
In the present study significant differences were found between the means of weight. The mean value of the male patients with diabetes was higher than the controls. The difference was very well expressed (p<0.001).
No statistical difference was detected among the thicknesses of sfTriceps (brachii) between the male patients with diabetes and the controls (p>0.05). The sfTriceps (brachii) of the diabetic patients was significantly thicker in comparison to the sfBiceps, sfForearm and sfCalf, but significantly thinner than sfSubscapular, sfXrib, sfSuprailiaca, sfAbdomen and sfThigh in the same group (ANOVA, p<0.001). The correlation analysis revealed many positive correlations between the thicknesses of sfTriceps and other skinfolds, as follows: the correlations were high to sfBiceps (r=0.76); strong to sfSubscapular, sfXrib, sfSuprailiaca, sfAbdomen, sfThigh and sfForearm (r=0.50-0.70), and moderate to sfCalf (r=0.41).
No statistically significant difference was found between the thicknesses of sfSubscapular in the diabetic male patients in comparison to the controls (p>0.05). The sfSubscapular of the diabetic patients was significantly thicker in comparison to the sfTriceps, sfSuprailiaca, sfBiceps, sfForearm, sfThigh and sfCalf of the same men (ANOVA, p<0.001). At the same time sfSubscapulare was significantly thinner than sfAbdomen (p<0.001). The correlation analysis revealed a lot of positive significant correlations between the thicknesses of sfSubscapular and other skinfolds, as follows: high correlations to sfSuprailiaca and sfAbdomen (r=0.70-0.90); strong correlations to sfXrib, sfTriceps, sfBiceps, sfForearm and sfThigh (r=0.50-0.70), and moderate correlations to sfCalf (r=0.34).
The thickness of sfXrib in the elderly diabetic male patients was significantly higher than the healthy controls. The difference was statistically significant (p<0.001). The sfXrib of the diabetic patients was significantly thicker compared to sfTriceps, sfBiceps, sfForearm, sfSuprailiaca, sfThigh and sfCalf of the same men, but it was thinner than sfAbdomen (ANOVA, p<0.001). The correlation analysis revealed many positive significant correlations between the thicknesses of sfXrib and other skinfolds, as follows: strong correlations to sfSubscapular, sfSuprailiaca, sfAbdomen and sfTriceps (r=0.50-0.70); moderate to sfBiceps, sfForearm, sfThigh and sfCalf (r=0.30-0.50).
We didn't detect any statistically significant difference among the thicknesses of sfSuprailiaca between the diabetic male patients and healthy controls (p>0.05). The sfSuprailiaca of diabetic patients was thicker in comparison to sfTriceps, sfBiceps, sfForearm and sfCalf of the same men, but it was thinner than sfSubscapular, sfXrib, sfAbdomen and sfThigh (ANOVA, p<0.001). The correlation analysis revealed many positive correlations between the thicknesses of sfSuprailiaca and other skinfolds, as follows: high correlations to sfSubscapular and sfAbdomen in the same topographical area (r=0.70-0.90), and strong correlations to other skinfolds (r=0.50-0.70).
No statistically significant difference was found among the thicknesses of sfAbdomen between the male patients with diabetes and healthy controls (p>0.05). It was the thickest skinfold among all studied skinfolds in the diabetic patients and the difference was very well expressed (ANOVA, p<0.001). The correlation analysis revealed many positive correlations between the thicknesses of sfAbdomen and other skinfolds, as follows: high correlation to sfSuprailiaca and sfSubscapular (r=0.70-0.90); strong - to sfXrib, sfTriceps, sfForearm, sfThigh and sfCalf (r=0.50-0.70), moderate - to sfBiceps (r=0.47).
There was no statistically significant difference between the thicknesses of sfBiceps in the elderly male patients in comparison to the controls (p>0.05). The sfBiceps was the thinnest skinfold in comparison to other studied skinfolds (ANOVA, p<0.05). The mean value of sfBiceps of diabetic patients was lower compared to sfForearm, but without significant difference (p>0.05). At the same time, we found that the thickness of sfForearm was significant higher than sfBiceps in the group of healthy men (p<0.05). The correlation analysis revealed many positive significant correlations to the thicknesses of the other studied skinfolds. The correlations were high to sfForearm and sfTriceps (r=0.70-0.90); strong - to sfSubscapular and sfSuprailiaca (r=0.50-0.70); moderate to sfXrib, sfAbdomen, sfTriceps and sfThigh (r=0.30-0.50); low to sfCalf (r=0.23).
There was no statistically significant difference between the thicknesses of sfForearm between the male patients with diabetes and healthy controls (p>0.05). The sfForearm was significant thinner than other investigated skinfolds, except sfBiceps. The correlation analysis revealed several positive significant correlations of the sfForearm thickness to the other skinfolds (p<0.001). The correlations were high to sfBiceps (r=0.75); strong to sfTriceps, sfSubscapular, sfSuprailiaca, sfAbdomen and sfThigh (r=0.50-0.70); moderate to sfXrib and sfCalf (r=0.30-0.50).
The thickness of sfThigh in the elderly male patients with diabetes was significantly lower than the controls (p<0.05). It was significantly thicker in comparison to the sfTriceps, sfBiceps, sfForearm and sfCalf, but significantly thinner than sfSubscapular, sfXrib and sfAbdomen (ANOVA, p<0.05). The correlation analysis revealed many positive correlations between the thickness of sfThigh and other studied skinfolds (p<0.05). The correlations were strong - to sfSubscapular, sfSuprailiaca, sfAbdomen, sfTriceps, sfForearm and sfCalf (r=0.50-0.70); moderate - to sfBiceps and sfXrib (r=0.30-0.50).
We didn't detect any statistically significant difference among the thicknesses of sfCalf between the male patients with diabetes and healthy controls (p>0.05). It was significantly thicker than sfBiceps and sfForearm, but it was significantly thinner than other studied skinfolds (ANOVA, p<0.001). The correlation analysis revealed several positive correlations between the sfCalf thickness and other skinfolds (p<0.05). The correlations were strong to sfSuprailiaca, sfAbdomen and sfThigh (r=0.50-0.70); moderate to sfSubscapular, sfXrib, sfTriceps and sfForearm; low to sfBiceps(r=0.23).
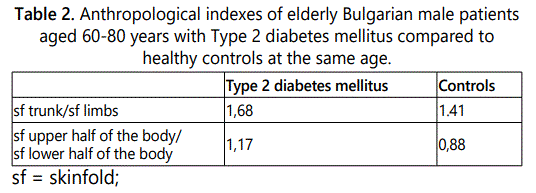
The accumulation of subcutaneous adipose tissue in elderly patients with Type 2 diabetes mellitus was higher in the torso, than in the limbs. In contrast, the controls exhibited an opposite distribution. In patients with Type 2 diabetes mellitus the accumulation of subcutaneous adipose tissue was larger in the upper half of the body, than in the lower half. The controls exhibited the opposite distribution it was statistically significant as demonstrated in Table 2.
Body Composition Parameters' Results, Investigated by
Bioelectrical Impedance Analysis
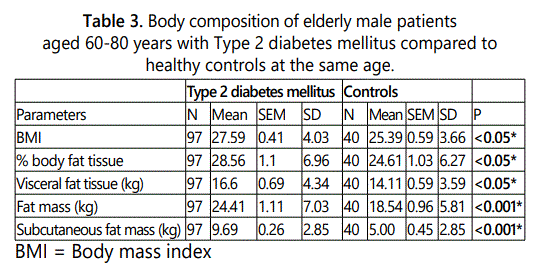
The BMI of the elderly male patients suffering from
diabetes was significantly higher than that of the healthy
controls (p<0.05). This index demonstrates a total deposition
of adipose tissue in the human body. The values of the %
body fat tissue of patients with diabetes were significantly higher than the controls (p<0.05). The values of visceral fat
tissue were significantly higher in the patients, than in the
controls (p<0.05). The mean value of fat mass in the male
patients was significantly higher than in the healthy controls
(p<0.001). The mean value of subcutaneous fat tissue was
significantly higher in the patients with diabetes than in the
healthy controls (p<0.001).
Discussion
This study is part of a complex survey involving T2DM male patients 40-60 years, 60-80 years, as well as female patients from both age groups in Bulgaria. The anthropological parameters provide a large data base, specific for Bulgarian population. Using the anthropological parameters it will be possible to calculate the components of the somatotype by Heath and Carter method of somatotyping, as well as other indexes. They will reveal the anthropological status of Bulgarian patients with T2DM.
It has been found that abdominal obesity, also known as central or visceral obesity, was more closely related to T2DM than the general obesity. The visceral fat is more metabolically active and produces more insulin resistance [6, 7, 8, 9]. Similar data were observed in Bulgarian men aged 60-80, with a diagnosis T2DM. The values of the "% fat mass", "visceral adipose tissue" and "adipose tissue-FM" were statistically higher in the elderly male patients with T2DM than in the healthy controls, demonstrated in table 3. It was considered that this type of obesity increased the risk of pathological changes in other systems, along with the progress of T2DM [10, 11, 12, 13].
Attention should be paid to the distribution of subcutaneous adipose tissue in patients with T2DM. Two significant differences were detected among the thicknesses of sfXrib and sfThigh between the elderly male patients and the healthy controls in this study. The skinfold thickness of Xrib in the patients with diabetes was significantly higher than the controls, but the skinfold thickness of Thigh in the healthy controls was significantly greater than the elderly patients, demonstrated in table 1. The common subcutaneous fat mass was significantly higher in the patients with diabetes than the controls. This difference was statistically significant (p<0.001), demonstrated in table 3. It was found that in patients with T2DM the accumulation of subcutaneous adipose tissue was primarily in torso and less in the limbs. The accumulation of adipose tissue consisted predominantly in the upper body as compared to the lower, the so-called „apple shaped", demonstrated in table 2. These patients have a worse anthropological status, that would lead to more severe clinical course of the disease [14, 15, 16, 17]. In controls the deposition of adipose tissue was predominantly in the limbs and mainly in the lower part of the body, the so-called „pear shaped". It can be assess by measurement of skin folds. This study revealed a lot of positive correlations among the skinfolds thicknesses. An interest induced the data indicating that skinfolds from topographically neighboring areas were in a stronger correlation with each other, than did skin folds from distant topographical areas. Some authors have reported the importance of adipose tissue accumulation in the anterior abdominal wall [18]. In this investigation the sfAbdomen was the thickest, compared to the other studied skinfolds in patients with T2DM, but it was not detected a significant difference compared to the thickness of the corresponding skinfold in the controls. Significantly greater skinfold thickness was measured in the control group than in the corresponding skinfolds in patients with T2DM, as happened with sfThigh only. These facts confirmed the greater importance of the accumulation of visceral fat than of subcutaneous fat for the prognosis of disease [19, 20, 21].
Total weight and BMI were higher in patients with diabetes than the controls (p<0.05). Men with T2DM were overweight and obese compared to healthy controls, but these values had less importance for the prognosis of disease compared with the above described parameters. [22, 23, 24]. More original data about the anthropological status of Bulgarian patients with T2DM were published in other our publications [25].
Conclusion
The body composition of elderly diabetic male patients with T2DM aged 60-80 years contained a larger common adipose component than the controls. The values of weight and BMI in the patients with diabetes were significantly higher than the controls.
The subcutaneous adipose tissue was accumulated mostly in the upper part of the torso in the patients with diabetes, opposite - in the group of healthy men (controls), the subcutaneous adipose tissue was accumulated mostly on the lower part of the body. In the group of elderly patients with diabetes the subcutaneous adipose tissue was accumulated predominant in the torso, than in the peripheral part of the body (arms, thighs and lower legs). The thickness of sfXrib in the diabetic patients was significantly higher than in the controls, but sfThigh was significantly thinner than the controls.
The bioelectrical impedance analysis of the body composition demonstrated that the common fat tissue and visceral adipose tissue in male patients suffering from T2DM was significantly more expressed than the healthy controls. These data revealed a worse anthropological status of the body composition in elderly male patients with T2DM.
The complex study including anthropometry of adipose tissue in men suffering from T2DM would support the evaluation of the prognosis of the disease.
Competing Interests
The author has declared that no competing interests exist. This research did not receive any specific grant from any funding agency in the public, commercial or not-for-profit sector. This article contains an original research and has not been submitted/published earlier in any journal and is not being considered for publication elsewhere. The paper was approved by the corresponding author.
Ethical Approval
An ethical approval was taken for this study from the Ethics committee by Medical University-Plovdiv, Bulgaria. Informed consents were taken from all patients involved in the study.
References
Contact us for any additional information - contact@madridge.org
 Madridge Publishers is licensed under a Creative Commons Attribution 4.0 International License.