Research Article
Statistical Research on Characteristics of Exoplanets
Jinling High School Hexi Campus, International Department, Nanjing, China
*Corresponding author: Xi Yan, Jinling High School Hexi Campus, International Department, Nanjing, China, E-mail: tina_yanxi@163.com
Received: June 07, 2021 Accepted: June 25, 2021 Published: July 02, 2021
Citation: Xi Yan. Statistical Research on Characteristics of Exoplanets. Int J Cosmol Astron Astrophys. 2021; 3(1): 125-129. doi: 10.18689/ijcaa-1000126
Copyright: © 2021 The Author(s). This work is licensed under a Creative Commons Attribution 4.0 International License, which permits unrestricted use, distribution, and reproduction in any medium, provided the original work is properly cited.
Abstract
In this article, main parameters of exoplanets and their host stars, including mass, orbital period, semi-major axis, density, etc., are used to analyze their physical properties. When the planet density is plot versus the semi-major axis for all available exoplanets, it is found that no obvious correlation could be observed. We then concentrate on multi-object planetary systems, which contain at least five planets. It is found that in some systems, there is an obvious positive correlation between the planet density and the semi-major axis, while others show no correlation or even a negative correlation between them. These two kinds of planetary systems seem to have different formation route. Especially, the latter group of planetary systems may have experienced some perturbations. Our study offers a closer look at the connections between exoplanets main parameters and their formation history.
Keywords: Exoplanets; Statistical characteristics; Orbital parameter; Density; Multi-star stellar system
Background
Exoplanets are planets that orbit around stars other than the Sun. Their masses are typically in the rage of 10-3M⊕ - 103M⊕. They can move around a single host star or multiple host stars [3]. The first exoplanets around a sun-like star were discovered in 1995. 277 exoplanets were discovered till March 13, 2009, and 555 exoplanets were discovered till June 9, 2011. As of January 11, 2021, according to publicized data on the NASA EXOPLANET ARCHIVE, the number of discovered exoplanets has increased rapidly to 4, 331. Therefore, the study of exoplanets becomes one of the most active field in astrophysics.
Before the discovery of exoplanets, all our understanding of planetary formation came from the only stellar planetary system known to human beings - the solar system. With the increase in the number of confirmed exoplanets and the rapid development of planetary system measurement disciplines, it is necessary to examine the orbital parameters and physical properties of exoplanets, such as their mass/radius/density, etc. Statistical studies of these parameters are valuable to our understanding of planetary formation and evolution [4], which may help answer a few important questions. For example, how many planets are there in a typical planetary system? What are the typical values of their masses, radii and orbital periods? How much are their orbit radii, eccentricities and inclinations? Among these issues, a most significant feature is the diversity of the orbital parameters of exoplanets, which may continue to challenge our current theories of planetary formation.
The mass was plot versus the semi-major axis for more than 270 exoplanets by [5]. It is shown that different types of planets are distributed in different regions on the plot, and there are also regions called the planetary desert in which no exoplanets exist [3]. Have systematically studied the relationship between the semi-major axis and the mass of exoplanets detected via the radial velocity method, focusing on the characteristics of large-mass planets [6]. Further study the semi-major axis and mass distribution based on more than 1770 exoplanets detected till 2014, focusing on the limitations of various detection methods, such as the transiting star method, the radial velocity method, the direct imaging method, etc. More interestingly [7], revealed a possible correlation between the two parameters: the semi-major axis (a) of planetary orbit is inversely related to the planet mass for relatively close-in exoplanets (a<0.3AU).
According to some formation theories of planetary systems, planets formed in the inner orbits will have a relatively larger density due to the effects of stellar wind and other factors. In this study, we will use the currently available exoplanet data to examine this hypothesis. We first refresh the statistical features of exoplanetsʼ parameters, based on the latest observational data available from the Caltech exoplanet database [1]. We then concentrate on the multiplanet stellar systems and compare them with our solar system.
Data Acquisition
Data source
We download the data from the website of the Caltech exoplanet database [1], which includes various parameters of both exoplanets and their host stars. We mainly focus on the parameters of the exoplanets. There are 4152 exoplanets in our sample. In our study, we use the Origin Pro software to plot figures. The dataʼs variety and large coverage from terrestrial planets to Jupiter-like ones, can meet the requirement of our study and also provide a solid foundation for the statistics.
Since the density of exoplanets is a key parameter for our study, to expand our dataset as far as possible, we have also downloaded available data from the EU exoplanet database of [2]. For convenience, we use the Jupiter density (ρjup) as the density unit. We have also calculated the parameter of gravity in units of Jupiter surface gravity (gjup= 24.79m/s2), i.e.,g =Mjup/Rjup2.
An overview of the data
Mass is an important parameter of exoplanets. It is directly related with the formation and evolution of planetary systems. Studying the distribution of semi-major axis and mass of exoplanets (the a-m distribution) is of great significance to theories of planetary formation and evolution. To be more specific, for unknown genres exoplanets, their locations on the a-m graph can imply their types. In Figure 1, we plot the masses of 4152 exoplanets versus their orbital periods and semi-major axis.

As shown in Figure 1(a) and 1(b), there are mainly three kinds of exoplanets [8]: (i) sub-Earth planets, which have a small mass (0.001-0.1Mjup) and a short orbital period (1-100 days); (ii) Hot Jupiters, which have a relatively large mass (0.1-10Mjup) and a short period (1-10 days); (iii) Cold super-Jupiters, which a large mass (1-50Mjup) and a long period (10-104 days).
In Figure 1, we can also note a weak tendency that with the increase of the semi-major axis, the planet mass generally becomes larger. It may be due to observational selection effects. At a large separation, large-mass planets are relatively easy to detect, while small-mass planets are extremely difficult to observe. From this figure, we can also find that there is no correlation between the semi-major axis and the mass, which is different from the conclusion drawn by [7].
Correlation of Exoplanet Parameters
Density-orbital period relationship
Density is an important parameter of exoplanet, which cannot be measured directly through telescopes, but can be derived from mass and radius. In Figure 2(a), we plot the planet density versus the orbital period. Similarly, Figure 2(b) illustrates the planet density versus the orbital semi-major axis.

In Figure 2, we see that the distribution of the data points is quite similar in the two panels. We could also note the following features from the plot. First, many of the data points are clustered in the lower left region of the figure. Their densities are mainly in the range of 0.1- 10jup', which corresponds to 0.025 - 2.5 times the density of the Earth. Comparing with the mass range of 0.001 - 100 Mjup as shown in Figure 1, the density is generally in a narrow range. It may be due to the fact that exoplanets are more commonly composed of gas or ice. Hot Jupiters, which are gas giants with a high surface temperature, are also the most common type of exoplanets observed so far. Second, the number of exoplanets with a density lower than 0.1ρjup is very small, indicating that only very few low-density planets has been found at present. The density of Earth is about 4 times that of Jupiter. So, there are very few planets lighter than 1/40 of the density of Earth. WASP-107b, the planet with the smallest density ever discovered, is a gas giant. Its density is about 1/44 of the Earth density. It is expected to become smaller and denser in the future, and may finally become an ice giant similar to Neptune. Thirdly, in the figure, the number of exoplanets with a density higher than 100ρjup is small. It means that planets heavier than 25 times of the density of Earth are still rare.
Finally, we have fit the observational data points in Figure 2 by a linear function. For Figure (2a), the best fit slope is 0.13, the correlation coefficient is 0.12. For Figure (2b), the best fit slope is 0.11, the correlation coefficient is 0.107. Generally, the correlation is very weak. We conclude that no obvious correlation exists between the density and the orbital parameters, either the period or the semi-major axis.
Multiple planet systems
As stated in Section 3.1, contrary to our expectations, no correlation between the orbital period and density is found. This may be due to the mixing of different planetary systems. Hence, the most valuable sample should be those planetary systems with multiple planets. Now we concentrate on multiplanet systems. In our study, we have selected multi-planet systems with planets of 5 or more. We then analyze whether there is any correlation among the parameters such as the mass, density, orbital radius and orbital period. We try to extract useful information concerning the formation and evolution of planetary systems.
In fact, our solar system is a typical multi-planet system. Interestingly, planetary systems with up to 7 - 8 exoplanets have also been found. For example, the red dwarf Trappist-1 has 7 planets and the G-type main-sequence star Kepler-90 has 8 planets [9]. Some theories have been successful in explaining the observational features of our Solar system, but a direct comparison with other multi-planet systems will still be helpful. In fact, the features of exoplanets around other stars are often quite different from those of our own Solar system. More detailed studies on the dynamics of multiplanet systems are necessary [5]. Therefore, in our study, we will compare these multi-object planetary systems with our Solar system directly.
Mass-orbit relationship of multi-planet systems
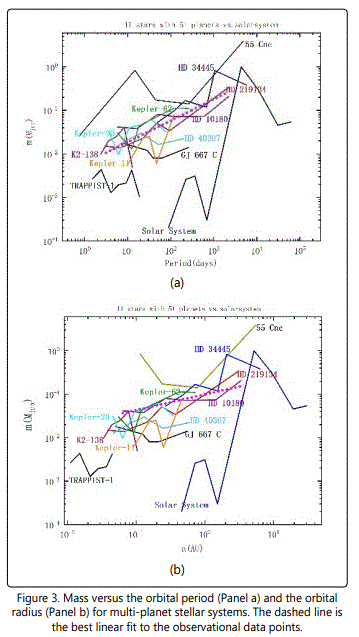
Figure 3(a) plots the mass versus orbital period for 11 multi-planet stellar systems, directly comparing with our solar system. Similarly, Figure 3(b) illustrates the mass versus orbital radius. The orbital period of the planets in the 11 star systems is between 1 and 104 days. Especially, about 50% of the planets have a relatively short period of 1-100 days. As a comparison, the orbital period of the eight major planets in the Solar system is between 102 and 105 days. Also, note that the shape of Figure 3(b) is quite similar to that of Figure 3(a).
From Figure 3(a), the top broken line corresponds to 55 CNC planetary system, which includes 5 planets. Its planetary structure characteristics is very similar to the Solar system. Interestingly, its broken line also has a similar shape as compared with our Solar system. The exoplanet of 55CNC d has the largest orbital period (close to 5x10³ days), which is comparable to that of our Jupiter. The other four planets, 55CNC b, 55CNC c, 55CNC e and 55CNC f, are all very close to the host star. Their orbital periods are less than 500 days so that they should be inner planets.

The broken line at the lower left corner corresponds to the red dwarf Trappsit-1 stellar system, which includes 7 planets. The masses of these 7 planets are very similar, ranging from 0.001 to 0.01Mjup. The mean mass of them is close to that of the Earth, so they can be regarded as 7 Earth-like planets. This is the planetary system with the most Earth-like planets found so far. So, TRAPPSIT-1 is also called a “mini solar system.” However, comparing with Earthʼs orbital period of 365 days, the seven planets of TRAPPSIT-1 all have a much smaller orbital period of 1-20 days. Thus they are much closer to their host star.
The dotted line of Figure (3a) and (3b) is the best linear fit to the observational data points. The best-fit slope in Figure (3a) is 0.49, the correlation coefficient is 0.95; while the slope in Figure (3b) is 0.36, the correlation coefficient is 0.85. It shows that for these 11 planetary systems, generally there is a positive correlation in the plot: the longer the orbital period is, the greater the mass will be. However, this positive correlation could also be due to the selection effect of observations, i.e., at a larger separation, massive planets could be more easily detected. Our Solar system is at the lower right region. It means that the planet mass in the Solar system is overall small. It is quite possible that there might also exist many less massive planets in other exoplanet systems, but they simply have not been observed due to current technical limitations.
Density versus orbital parameters for multi-planet systems
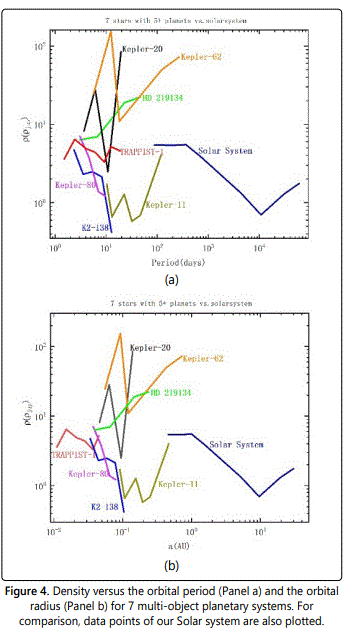
In this section, we investigate the relationship between density and orbital characteristics for multi-planet systems. In our sample, there are only 7 multi-planet (with no less than 5 planets) systems with planet densities available. In Figure 4, we plot the density versus orbital parameters for these 7 planetary systems, comparing them with the Solar system. Figure 4(a) shows the density versus the orbital period. Figure 4(b) shows the density versus the orbital semi-major axis. Again, we see that the distribution of the data points is quite similar in these two panels.

The densities of the seven planetary systems distribute in a large span, ranging from 0.1 Jupiter density to 100 Jupiter density. K2-138f has the lowest density, i.e. only 0.4 Jupiter density, which is even lower than that of Saturn. There are also a few high-density planets, such as Kepler-62 C, with a density up to 154 Jupiter density. Interestingly, the densities of the eight planets in the Solar system are distributed in a relatively narrow range of 0.7 - 5.5 Jupiter density. For example, Saturn has a density of 0.7 Jupiter density and the Earth has a density of 5.5 Jupiter density.
In Figure 4, the red broken line on the left is the red dwarf Trappsit-1 planetary system. The densities of its seven planets are very close, all in the range of 3.6 - 6.5 Jupiter density. Among them, the densities of three planets are similar to the Earth and three planets are similar to that of Mars. It further proves that TRAPPSIT-1 has the most Earth-like planets and is a planetary system that is very similar to the Solar system.
In Figure 4, we see that there are two kinds of relationship between the density and the orbital parameters. First, K2-138 and Kepler-80 show a negative correlation: the longer the orbital period is, the less the dense will be. It is interesting to note that our Solar system basically follow this trend. This negative correlation behavior is consistent with the general expectation of planet formation theory. During the formation of a multi-object planetary system, low density material is likely to be expelled by the stellar wind so that low density planets should reside in larger orbits while inner planets generally have a higher density.
Second, HD 219134 shows a positive correlation: the longer the orbital period is, the denser the exoplanet will be. For other systems such as Kepler-62, Kepler-20, Kepler-11 and Trappsit-1, their planet densities fluctuate rapidly so that no clear correlation could be observed. In all these systems, the density pattern deviates from the theoretical expectations. We suggest that it may be due to some perturbation processes. For example, planets may migrate from their original orbit of birth and enter a new orbit. Also, the mass and density of planet may change due to collisions with each other. Finally, it is also possible that planet formation may be conducted through different processes.
Conclusion
In this paper, we conducted a statistical analysis on the properties of the currently observed exoplanets, aiming to provide useful clues on the formation process of planetary systems. The sample data used in our study are mainly taken from the exoplanets website [1,2]. When all the exoplanets are plot together, it is found that no obvious correlation, neither positive nor negative, exists between the orbital period/semi-major axis of exoplanets and the density of planets. This may be because different planetary systems are mixed together so that any underlying features may be largely covered and obscured. Therefore, we then further conduct statistical analysis on the multi-planet systems. It is found that the orbital period is positively correlated with the mass, i.e., an exoplanet with a longer orbital period is generally more massive. However, this positive correlation may be due to the selection effect. For the relationship between the orbital period and the density, it is found that some exoplanet systems (K2-138, Kepler-80) show an inverse correlation. This behavior is consistent with theoretical expectations. According to usual planet formation theory, planets formed in inner orbits should have a relatively larger density. It is interesting that our Solar system also largely follows this rule. However, it is also noted that many planetary systems do not follow such a simple rule. No obvious correlation could be observed in the systems of Kepler-62, Kepler-20, Kepler-11, and Trappsit-1. HD 219134 even shows a clear positive correlation, in which the outer planets have a larger density.
Based on our statistics and analysis, it is quite possible that there may be two kinds of exoplanet systems, one follow the theoretically expected density-orbital period correlation, while the other groups do not. These two kinds of systems may be of different origins. Especially, the latter systems may have experienced some kinds of perturbations, such as migrations, collisions, evaporations, etc.
With the continuous improvement of the detection technology and observational accuracy in the future, more and more exoplanets will be discovered. More sample data will be available for the study of the properties of exoplanets. It is expected that the formation process of exoplanets will be more thoroughly revealed.
Acknowledgements
I would like to thank Professor Yong-feng Huang for stimulating discussions and helpful suggestions. This research has made use of the NASA Exoplanet Archive, which is operated by the California Institute of Technology under contract with the National Aeronautics and Space Administration. This research has also made use of the Exoplanet Encyclopedia data base, which was supported by the European Unionʼs Horizon 2020 research and innovation program under grant agreement No.654208.
References
- Zou Z. High Z Galaxies and Exoplanets. Progress in Astronomy. 2003; 21(3): 269-274.
- Zhang N, Ji J. The Detection Methods and Statistical Characteristics of Exoplanet. Progress in Astronomy. 2009; 27(1): 24.


