Research Article
Calculation of the Frequency and Line width of the IR Modes as a Function of Temperature in DMMg and DMCd
1Lapseki ICDAS CİB MTAL High School, 17100, Canakkale, Turkey
2Department of Physics, Middle East Technical University, 06531, Ankara, Turkey
3Department of Physics, Canakkale 18 Mart University, 17100, Canakkale, Turkey
*Corresponding author: Hamit Yurtseven, Professor, Department of Physics, Middle East Technical University, Ankara, Turkey, E-mail: hamit@metu.edu.tr
Received: February 6, 2019 Accepted: February 15, 2019 Published: February 22, 2019
Citation: Kurt A, Yurtseven H, Kurt M. Calculation of the Frequency and Line width of the IR Modes as a Function of Temperature in DMMg and DMCd. Int J Chem Res. 2018; 1(1): 19-23. doi: 10.18689/ijcr-1000104
Copyright: © 2019 The Author(s). This work is licensed under a Creative Commons Attribution 4.0 International License, which permits unrestricted use, distribution, and reproduction in any medium, provided the original work is properly cited.
Abstract
Frequency and line width of the νS (CNC) and ρ (NH2) infrared modes are calculated as a function of temperature from the an harmonic self-energy for the two metalorganic frameworks (MOFs) of (CH3)2NH2M(HCOO)3, M=Mg and Cd, abbreviated as DMMg and DMCd. Expressions obtained from the an harmonic self-energy for the frequency and line width are fitted to the experimental data from the literature for the νS (CNC) and ρ (NH2) IR modes of DMMg and DMCd.
We find that the anharmonic self-energy model explains adequately the observed behavior of DMMg which exhibit phase transition, whereas DMCd does not exhibit any phase transitions occurring due to the an harmonic interactions in those two metal organic frameworks (MOFs).
Keywords: Phase transitions; DMMg; DMCd; Metal organic frameworks (MOFs); IR modes.
Introduction
Multiferroic properties in perovskites have been the subject of many studies, in particular in the family of metal organic frameworks (MOFs), DMM compounds with M=Mn, Mg, Zn, Ni, Co and Fe [1-7]. Among those MOFs, temperature-dependent IR and Raman and pressure-induced Raman scattering studies in perovskite formats (CH3)2NH2Mg(HCOO)3 and (CH3)2NH2Cd(HCOO)3, namely, DMMg and DMCd, respectively, have also been reported [8,9]. Regarding those two perovskites (DMMg and DMCd), DMMg undergoes a paraelectric-ferroelectric transition at 270K [8,10-12] where as X-ray diffraction and spectroscopic studies on Cd-compound as a function of temperature reveal that DMCd does not undergo any structural phase transition [8]. High-pressure Raman studies have been reported for DMMg and DMCd revealing the presence of a few pressure-induced phase transitions [9]. Perovskites DMMg and DMCd crystallize in the trigonal R-3C space group and they change to the monoclinic Cc space group [11,13]. The DMCd is isostructural to the room temperature structure of the DMMg [11], as also pointed out previously [9]. In the ABX3 perovskite structures such as DMMg and DMCd compounds, metal cations (B) are linked by formate group (X=HCOO-) to form BX3 skeleton and the dimethylammonium cations (DMA, A in the formula) occupy the cavities [5,8,10]. The amine hydrogen atoms of DMA molecules from hydrogen bonds with the oxygen atoms of the formate frameworks [8]. The formate anions link metal centers in anti-anti mode configuration forming a pseudo-perovskite metal-formate framework and the DMA+ cations located in the cavities of that framework interact by hydrogen bonds with formate oxygen atoms [8].
For the compounds of DMMg and DMCd, the temperature dependence of the wave number and FWHM for the νS (CNC) and ρ (NH2) infrared (IR) modes have been studied experimentally. Very recently, we have calculated [14] the frequency (wave number) and the damping constant (FWHM) of those IR modes by using the molecular field theory and the pseudo spin-phonon coupling models as a function of temperature close to the phase transition in DMMg (Tc=270K). In this study, we calculate the temperature dependence of the frequency and the line width as the real and imaginary part of the anharmonic self energy respectively, for the νS (CNC) and ρ (NH2) IR modes of DMMg and DMCd perovskites. For this calculation, we use the observed data for the wave number and FWHM of those IR modes [8]. The expressions derived from the anharmonic self-energy for the frequency (real part) and line width (imaginary part) are fitted to the observed data [8] for both pervoskites (DMMg and DMCd).
Below, we give our calculations and results from the anharmonic self energy for DMMg and DMCd in Calculations and Results Section. Discussion and Conclusion Sections give discussion and conclusions.
Calculations and Results
Changes in the vibrational frequencies with temperature are contributed by thermal expansion and anharmonic interactions in crystals. The crystal potential can include cubic and quartic anharmonic terms [15]. The resulting correction to the harmonic energy is called the anharmonic self-energy which has real and imaginary components [16] given by

In Equation (1), Δ(λ) is the frequency shift of a mode with a particular wave vector and polarization (real part of the selfenergy) and 2Γ(λ) is the full width at half maximum (imaginary part of the self-energy). Cubic and quartic anharmonic terms contribute to the real part, Δ(λ), whereas only cubic anharmonic terms contribute to the imaginary part, Γ(λ), in the second-order perturbation [15] as also pointed out previously [16] which gives

Where the average occupation number is defined as

with the harmonic frequency ω0(λ′) and the Boltzmann constant kB. In Equation (2), C(λ) and C(λ, λ′) are taken as the temperature independent factors, which depend on the strengths of the cubic and quartic interactions and on the crystal configuration [16]. By assuming that the phonon frequency interacts only with another phonon, its frequency can be written as

where the average ω1(λ) and ω2(λ) are constant as the harmonic frequency ω0(λ). Equation (4) then gives the temperature dependence of the phonon frequencyω(λ).

The temperature dependence of the line width can also be obtained from the imaginary part of the anharmonic self-energy (Equation 1) including the cubic anharmonic term in the potential [15,16]. By considering one dominant cubic anharmonic interaction for the phonon (ω) with a second phonon (ω′) producing a third one (ω′′) according to ω′′ = ω + ω′, the temperature dependence of the line width can be obtained as [16].

Thus, Equations (4) and (5) can be used to calculate the temperature dependence of the phonon frequency and line width, respectively, according to the anharmonic self-energy model. For the temperature dependence of the Eg librational frequency and for its line width of the α phase of solid nitrogen, Equations (4) and (5) were fitted to the observed data [16]. We have also applied the anharmonic self-energy model (Equations 4 and 5) to predict the Raman frequency shifts of the N2 vibrons with the lower frequency ν2 and the higher frequency ν1 in our earlier study [17]. For the metal organic frameworks (MOFs), the an harmonic effects are also important, as studied for the IR bands ν4(NH+4) of NH4Zn(HCOO)3 and ND4Zn(DCOO)3 [18].

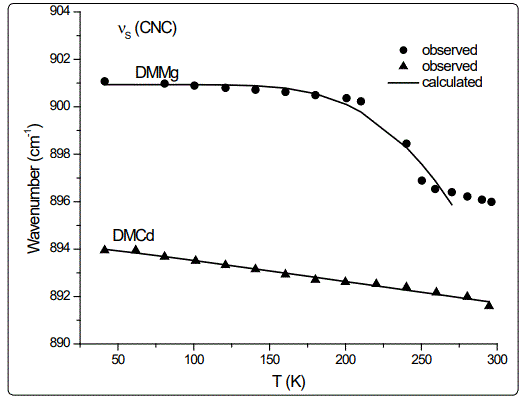
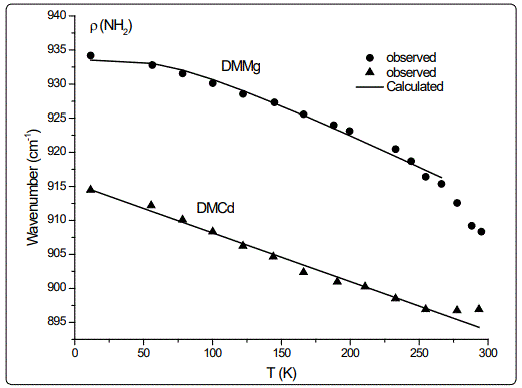
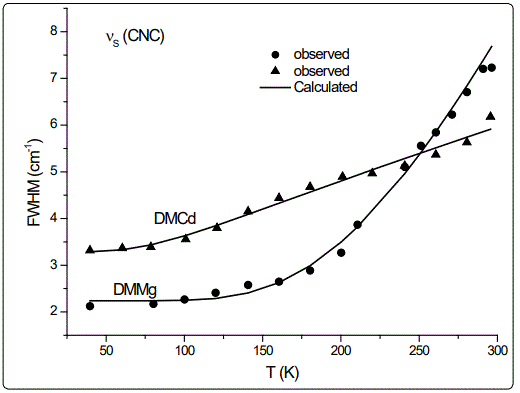
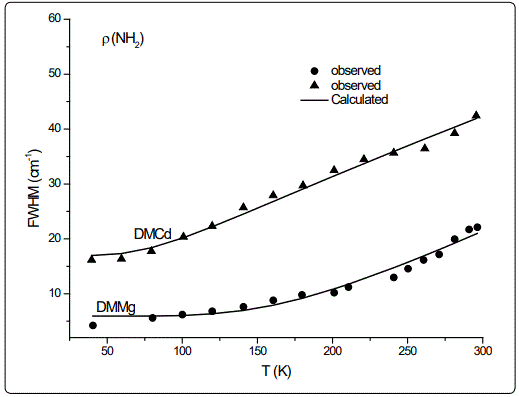
In this study, we calculated the temperature dependence of the IR frequency and line width for the νS (CNC) and ρ (NH2) modes by fitting Equations (4) and (5), respectively, to the observed data [8] in the case of DMMg and DMCd crystalline systems. We give in figures 1 and 2, the wave number calculated for the νS (CNC) and ρ (NH2) IR modes respectively, as a function of temperature according to Eq.(4) for the DMMg and DMCd by using the anharmonic self-energy model. Observed wave numbers for both IR modes [8] are plotted in these figures. The fitted parameters (Equation.4) are given in table 1. Equation (4) was fitted to the observed wave numbers of the νS (CNC) and ρ (NH2) IR modes below TC (=270 K) for DMMg and for all temperatures for DMCd since it does not exhibit any phase transition [8], as given in figures 1 and 2. Figures 3 and 4 give line widths (FWHM) calculated (Equation 5) with the observed data [8] for the νS (CNC) and ρ (NH2) IR modes, respectively, for DMCd and DMMg. They were obtained by fitting Equation (5), to the observed FWHM [8] of those MOFs with the fitted parameters as given in table 2. For the fitting procedure (Equations 4 and 5), the constant ratio ħ/kB was taken unity (=1).
Discussion
The observed behaviour of the IR wave number which decreases (Figures 1 and 2) while FWHM increases (Figures 3 and 4) as the temperature increases, was obtained by fitting Equations (4) and (5) in the anharmonic self-energy model to the experimental data for the νS (CNC) and ρ (NH2) modes of DMMg and DMCd. This shows that the temperature dependence of the observed frequency and line width of the IR modes studied can be explained in terms of the real and imaginary parts of the self-energy for DMMg and DMCd. There occurs a jump in the wave number of the and νS (CNC) and ρ (NH2) IR modes of DMMg at around Tc=270K (Figures 1 and 2) due to the ordering of the dimethylammonium cations (DMA+) whereas this phase transition is not shown clearly by FWHM of those modes (Figures 3 and 4). Increase in FWHM indicates that the phase transition in DMMg has an orderdisorder character and is associated with the dynamics of dimethylammonium (DMA+) cations. This is governed by the second term in Equation (5) which gives information on thermally activated reorientational processes. In the low temperature structure, the distortion of the metal formate framework is weak and the DMA+ cations are ordered for both compounds of DMMg and DMCd, in particular for DMMg, lowering of temperature changes the dynamical disorder of the DMA+ cations into static disorder without any distortion of the framework structure so that dynamic of hydrogen bonds play a major role in the mechanism of the phase transition in DMMg [8]. This is because of the fact that at low temperatures, strength of the hydrogen bonds increases and at a certain temperature it becomes strong enough to cause freezing of the reorientational motions of DMA+ cations and distortion of the metal formate framework [8]. Ordering of the DMA+ ions at low temperatures also indicates the multiferroic behavior of those compounds studied. On the other hand, DMCd does not undergo any structural phase transition, which can be attributed to the large size of the cavity occupied by the dimethylammonium cations and weak hydrogen bonding between those cations and formate ions [8]. It has also been pointed out that at room temperature, hydrogen bonds are too weak to overcome the thermally activated motions of DMA+ and these ions are dynamically disordered within three symmetrically equivalent positions [8]. At low temperatures, due to the freezing of the reorientational motions of the (DMA+) cations a strong decrease, in particular, in FWHM for the ρ(NH2) IR mode of DMMg (~15cm-1 at 40K) and some narrowing in FWHM of this IR mode (~15cm-1 at 40K) of DMCd, occur as shown in figure 4.
As pointed out previously [8], temperature-dependent Raman and IR studies monitor changes in the local structure and lead to deeper insight into microscopic mechanism of the phase transitions, in general, for MOFs, in particular, those compounds of DMMg and DMCd. The vibrations of the studied compounds can be attributed to internal vibrations of DMA+ and formate ions as well as lattice vibrations [8]. In the region of internal vibrations of formate anions, the presence of the phase transition in DMMg has been observed, in particular, abrupt changes for the Raman modes of ν1 (2870 cm-1), ν5 (1370 cm-1) and ν2 (1350 cm-1) indicate the first order transition in this compound [8].
Regarding the IR modes of ρ(NH2) and νS (CNC) as we studied here, the jump discontinuity occurring in the temperature dependence of the IR frequency for the νS (CNC) mode is more apparent (Figure 1) compared to that of ρ(NH2) mode (Figure 2) of DMMg. In the case of those stretching modes of the NH2 group, namely, ρ(NH2) and νS (CNC) of DMCd, their IR frequencies decreasing linearly with increasing temperature (Figures 1 and 2). This behaviour of the IR modes of ρ(NH2) and νS (CNC) indicate that the first order transition exists in DMMg and the lack of any structural phase transition in DMCd, as we calculated from the anharmonic self-energy model, which has also been observed experimentally [8]. Accordingly, although it is not apparent as the IR frequencies of those modes studied, their bandwidths (FWHM) increase non-linearly (DMMg) and a linear (DMCd) increase with increasing temperature (Figures 3 and 4) also indicate a structural transition in DMMg but not in DMCd. It has been pointed out that the FWHM values of the bands related to the methyl moieties do not exhibit significant changes and in the case of DMCd, no splitting of the Raman and IR bands upon cooling has been observed, indicating absence of any structural phase transition in this compound [8]. Additionally, Raman spectra in the low-wave number range do not show any presence of mode softening, which confirms the orderdisorder nature of the phase transition in DMMg.
Note that although DMCd does not exhibit the temperatureinduced phase transition, it undergoes two pressure-induced phase transitions. The first transition (between 1.2 and 2 GPa) leads to subtle structural changes associated with distortion of anionic framework and the second one (~3.6 GPa) leads to significant distortion of the framework [9]. Regarding the pressure-induced phase transitions in DMMg and DMCd, frequencies and line widths of modes involving the mechanism of phase transitions, can be calculated by using the anharmonic self-energy model in those MOFs.
Conclusions
IR frequencies and the line widths of the νS (CNC) and ρ (NH2) modes of DMMg and DMCd crystals were calculated by using the anharmonic self-energy model. Temperature dependence of their frequency and line width were fitted to the experimental data for DMMg and DMCd from the literature. This fitting was performed for the wave number below the transition temperature of DMMg (Tc=270K) and up to 300K for DMCd (no phase transition occurred).
Our results show that IR frequencies of the νS (CNC) and ρ (NH2) modes decrease while their line widths increase with increasing temperature up to the room temperature (T=300K), which were predicted from the anharmonic self-energy model, as observed experimentally for DMMg and DMCd. On the basis of our analysis, frequencies and line widths of IR and Raman modes can be calculated from the anharmonic selfenergy model for some other MOFs.
References
- Jain P, Ramachandran V, Clark RJ, et al. Multiferroic behavior associated with an order-disorder hydrogen bonding transition in metal-organic frameworks (MOFs) with the perovskite ABX3 architecture. J Am Chem Soc. 2009; 131(38): 13625-13627. doi: 10.1021/ja904156s
- Fu DW, Zhang W, Cai HL, et al. A Multiferroic Perdeutero Metal-Organic Framework. Angew Chem Int Ed Engl. 2011; 50(50): 11947-11951. doi: 10.1002/anie.201103265
- Tan JC, Jain P, Cheetham AK. Influence of ligand field stabilization energy on the elastic properties of multiferroic MOFs with the perovskite architecture. Dalton Trans. 2012; 41: 3949-3952. doi: 10.1039/C2DT12300B
- Asaji T, Ashitomi K. Phase Transition and Cationic Motion in a Metal-Organic Perovskite, Dimethylammonium Zinc Formate [(CH3)2NH2][Zn(HCOO)3]. J Phys Chem. 2013; 117(19): 10185-10190. doi: 10.1021/jp402148y
- Tian Y, Stroppa A, Chai Y, et al. Cross coupling between electric and magnetic orders in a multiferroic metal-organic framework. Sci Rep. 2014; 4: 6062. doi: 10.1038/srep06062
- Sanchez-Andujar M, Gomez-Aguirre LC, Pato-Doldan BS, et al. First-order structural transition in the multiferroic perovskite-like formate [(CH3)2NH2][Mn(HCOO)3]. Cryst Eng Comm. 2014; 16: 3558. doi: 10.1039/C3CE42411A
- Maczka M, Zierkiewicz W, Michalska D, Hanuza J. Vibrational properties and DFT calculations of the perovskite metal formate framework of [(CH3)2NH2][Ni(HCOO3)] system. Spectrochim Acta A Mol Biomol Spectrosc. 2014; 128: 674-680. doi: 10.1016/j.saa.2014.03.006
- Szymorska-Malek K, Trzebintowska-Gutowska M, Maczka M, Gagor A. Temperature-dependent IR and Raman studies of metal–organic frameworks [(CH3)2NH2][M(HCOO)3], M=Mg and Cd. Spectrochim Acta A Mol Biomol Spectrosc. 2016; 159: 35-41. doi: 10.1016/j.saa.2016.01.031
- Maczka M, Almeida da Silva T, Paraguassu W, Pereira da Silva K. Raman scattering studies of pressure-induced phase transitions in perovskite formates [(CH3)2NH2][Mg(HCOO)3] and [(CH3)2NH2][Cd(HCOO)3]. Spectrochimica Acta Part A: Molecular and Biomolecular Spectroscopy. 2016; 156: 112-117. doi: 10.1016/j.saa.2015.11.030
- Pato-Doldan B, Sanchez-Andujar M, Gomez-Aguirre LC, et al. Near room temperature dielectric transition in the perovskite formate framework [(CH3)2NH2][Mg(HCOO)3]. Phys Chem Chem Phys. 2012; 14: 8498-8501. doi: 10.1039/C2CP40564D
- Rossin A, Ienco A, Costantino F, et al. Phase Transitions and CO2 Adsorption Properties of Polymeric Magnesium Formate. Cryst Growth Des. 2008; 8: 3302-3308, doi: 10.1021/cg800181q.
- Asaji T, Yoshitake S, Ito Y, Fujimori H. Phase transition and cationic motion in the perovskite formate framework [(CH3)2NH2][Mg(HCOO)3]. J Mol Struc. 2014; 1076: 719-723. doi: 10.1016/j.molstruc.2014.08.037
- Gao S, Ng SW. Poly[dimethylammonium [tris(μ2-formato-κ2O:O′)cadmate(II)]]. Acta Cryst. 2010; 66: m1599. doi: 10.1107/S1600536810046830
- Yurtseven H, Arslan A. Calculation of the Raman frequency and the damping constant (linewidth) of the stretching modes for the metal-organic compound DMMg close to the paraelectric-ferroelectric transitions. Ferroelectrics. 2018; 526: 9-15. doi: 10.1080/00150193.2018.1456135
- Medina FD, Daniels WB. Raman spectrum of solid nitrogen at high pressures and low temperatures. J Chem Phys. 1976; 64: 150-161. doi: 10.1063/1.431966
- Yurtseven H, Kurt M. Band-widths of the Raman stretching modes as a function of pressure in solid nitrogen. Trends in Applied Spectroscopy. 2012; 9: 49-54.
- Maczka M, Kadlubanski P, Freire PTC, et al. Temperature- and pressure-induced phase transitions in the metal formate framework of [ND4] [Zn(DCOO)3] and [NH4][Zn(HCOO)3]. Inorg Chem. 2014; 53(18): 9615-9624. doi: 10.1021/ic501074x
