Research Article
The Effect of Atenolol on QT Interval in Instrumented Beagle Dogs
Zionsville Community High School, Zionsville, USA
*Corresponding author: Charles Chiang, Zionsville Community High School, Zionsville, USA, E-mail: charlie.c.chiang@gmail.com
Received: December 3, 2018 Accepted: January 24, 2019 Published: February 4, 2019
Citation: Chiang C, Moser D. The Effect of Atenolol on QT Interval in Instrumented Beagle Dogs. Madridge J Nov Drug Res. 2019; 3(1): 106-113. doi: 10.18689/mjndr-1000116
Copyright: © 2019 The Author(s). This work is licensed under a Creative Commons Attribution 4.0 International License, which permits unrestricted use, distribution, and reproduction in any medium, provided the original work is properly cited.
Abstract
In cardiology, the QT interval is a measurement of the heartʼs electrical cycle between the start of the Q-wave and end of the T-wave in electrocardiogram (ECG). Assessment of the QT interval is of clinical importance because prolongation of repolarization may be associated with malignant ventricular arrhythmias and sudden cardiac death. Atenolol, a beta-blocker, is an effective anti-hypertensive agent that its protective effect may reduce the QT interval in some patients. However, the data of atenolol in animals or patients with long-QT syndrome are limited. The goal of this paper was to evaluate the effect of atenolol on QT interval in beagle dogs. Two experiments conducted by the Health and Environmental Sciences Institute were used for the evaluation. In two Latin-square studies, beagles were given varying levels of atenolol on separating dosing days and their ECGs were measured telemetrically. As QT interval is correlated with heart rate, we investigated the relationship between heart rate and QT interval using the vehicle control group animals. In addition to QTcF, QT interval corrected based on Fridericiaʼs formula, QTcP, which was based on the study population, and QTcI, which was derived from each individual animal, were evaluated. QTcF, QTcP, and QTcI were analyzed for each dose group at each time point compared to the vehicle. The analyses suggest that atenolol does not affect QT interval in beagle dogs.
Keywords: QT Interval; Heart rate; Atenolol; Beagle dog; Latin square design.
Introduction
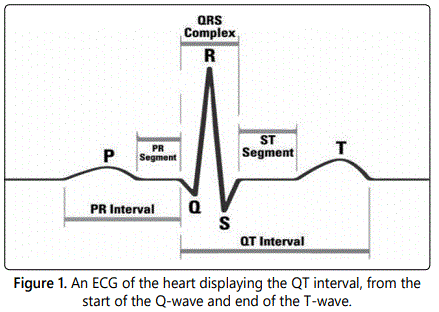
In cardiology, the QT interval is a measurement of the heartʼs electrical cycle between the start of the Q-wave and end of the T-wave as seen on electrocardiograms (Figure 1). It measures the time interval between depolarization and repolarization of the ventricles in the heartʼs electrical cycle. The QT interval, when corrected for heart rate (QTc), is useful for detecting congenital and acquired heart diseases that can lead to fatal arrhythmias [1]. Long-QT syndrome is a notable example that is characterized by chronic lengthening of the QT interval which can result in fainting, seizures, and ventricular fibrillation. This disease can be inherited or acquired when taking drugs that inadvertently block cardiac potassium channels. In extreme cases, long-QT syndrome can lead to Torsades des Pointes, a potentially fatal type of ventricular tachycardia.
As there is currently no drug approved for patients with long-QT syndrome, most treatment options have been limited to beta-blockers, therapeutic anti-hypertension drugs. Beta-blockers inhibit the binding of norepinephrine and adrenaline nerves, which subsequently lowers heart rate and reduces the risk for heart disease [2]. Atenolol, a beta-1 adrenergic receptor blocker, is a prescription drug used in treating patients with cardiovascular disease and lowering blood pressure [3]. Since its introduction in 1976, it has replaced propranolol in treating hypertension and has seen widespread use throughout the world. Adrenergic nerves stimulate the cardiac function and regulate cardiac outputs. Atenolol blocks specific receptor adrenergic nerves, decreasing cardiac stimulation. This allows the heart to beat at a slower rate, reducing the blood flow through arteries and decreasing blood pressure. Atenolol has also been used as an off-label treatment for long-QT syndrome [4,5].
Though atenolol has been frequently prescribed, there is a lack of conclusive data on its efficacy on the QT interval. We hypothesize that atenolol is an effective treatment for long-QT syndrome. To test this, we used animal data based on experiments conducted from two different laboratories. Each laboratory used eight beagle dogs in their experiment. The data, courtesy of Health and Environmental Sciences Institute, was taken continuously from each of the eight dogs using cardiac telemetry, with a small device implanted in the dogʼs heart, allowing researchers to monitor various aspects of each dogʼs heart function over a period of twenty-four hours [6]. The implants transmitted data continuously, and averaged data of ten-minute intervals for twenty-four hours was made available to the public. As each experiment was conducted using a double 4 × 4 Latin-square design, data was organized by dosing group, vehicle control, low-dose, medium-dose, and high-dose of atenolol. Each animal was administered to a different dose group on four separate dosing days.
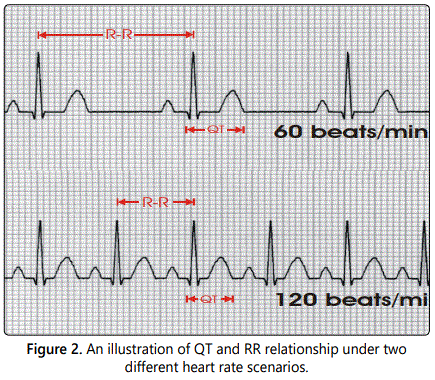
While other measurements of cardiac function and ECG were collected, our primary interest was the length of the QT and RR intervals, which has not been published previously. The RR interval is the length between one peak of an ECG wave and the peak of the next wave. The RR interval is inversely related to heart rate; in fact, RR in millisecond is equal to 60*1000 divided by heart rate in beats per minute. The QT interval can be affected directly by a drug or indirectly by the drug induced heart rate change, making it difficult to accurately measure the drugʼs direct effects on the QT interval (See figure 2) for an illustration. Therefore, the QT interval is often corrected for the change in heart rate or RR, denoted by QTc or corrected QT interval [7]. Fredericaʼs correction formula, known as QTcF, is commonly used in human and is calculated using a correction constant of 1/3 to account for the length of the QT interval compared to the RR interval, i.e.,  . However, Fredericaʼs formula was derived from human it may not be suitable for beagle dogs. In The layout of this paper is as follows. In this paper, we attempted to derive and compare appropriate formulas for correcting the QT interval in beagle dogs. Treatment effects of atenolol were statistically evaluated using two-sided t-test for each dose level at each time point.
The layout of this paper is as follows. In Methods section, we describe the experimental designs, data collection, and methods to conduct the statistical analysis. We also discuss the statistical models to identify an appropriate heart rate correction formula for QT interval in beagle dogs. In Results section, we evaluate and summarize the performance of various heart rate correction formulas. The statistical analyses of atenolol effects on these QTc intervals are summarized. Discussion and concluding remarks are given in one section.
Methods
Experimental design
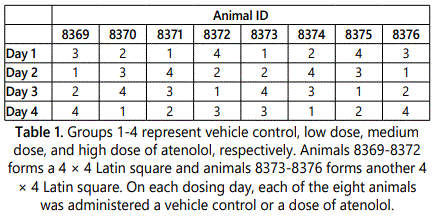
The data was obtained from studies performed by two independent laboratories through Health and Environmental Sciences Institute [6]. The ECG data has not been published previously. Beagle dogs from Lab 1 were sourced from Marshall Farms, and Covance Research Products provided beagle dogs for Lab 2. All beagle dogs were examined to confirm their health and suitability according to local procedure. Each laboratory used DSI Physiotel™ D70-PCTP telemetry instrumentation. The telemetry system was surgically implanted into dogs under general anesthesia under procedures approved by each laboratoryʼs local internal review board. All animals were given sufficient recovery time from surgery prior to the beginning of the study. Each study was conducted using eight beagle dogs, all males, given three different doses of atenolol as well as a vehicle on four different dosing days with a minimum 72-hour washout period in between. This was done using a double 4 × 4 double Latin square design. Atenolol was administered orally, with deionized water as vehicle control. Group 1 administered vehicle control, Group 2 (low dose) 0.3 mg/kg, Group 3 (medium dose) 1 mg/kg, and Group 4 (high dose) 3 mg/kg of atenolol. See table 1 for an illustration of the design from Lab 2.
QT Correction for heart rate
Digital ECG signals were continuously acquired from at least one hour prior to dosing through 24 hours post dose on each dosing day. Derived data were calculated for every cardiac cycle and the results were collapsed into 10-minute mean values available for analysis. In order to investigate the relationship between QT and RR without the influence of treatment effect, we used only vehicle control group. Luo et al. [8] shows that the relationship may be linear on a logarithmscale. Using only the vehicle control group data in each study, the relationship between log (QT) and log (RR) were plotted for each animal. A least-squares regression line was estimated using the following model,
log(QT)=a+c log(RR)+e,
where e was assumed to follow a Normal distribution. The lineʼs slope estimate ĉ and its standard error were summarized. The slope estimate ĉ is also known as the correction factor because if we let the intercept estimate â=log (QTcF), then from the above equation

And hence

Fridericia estimated that a factor of ĉ=1/3 is adequate in human. To confirm that Fridericiaʼs correction factor of 1/3 was adequate in beagle dogs, a 95% confidence interval for the slope was derived for each animal. If the 95% confidence interval did not contain 1/3, then Fridericiaʼs formula may not be adequate for beagle dogs. The slope estimates were averaged to derive the study-specific QT interval correction factor. The QTcP was calculated using the following formula:  , where p is the average of the slope estimates from all animals in each study. The QTcI was calculated using
  , where ci is the slope estimate of i-the animal in each study. QTcP is the QT interval corrected with the population slope factor, and QTcI is the QT interval corrected with an individualʼs slope factor. The QTcP takes a more universal, applicable approach to the QT rate-correction; the QTcI is more individualized and animal-specific.
Statistical analysis
For each of the QTcF, QTcP, and QTcI interval, data were collapsed into hourly averages for each dog. The hourly intervals were derived based on the averages of six of the 10-minute mean values, resulting a baseline at time 0 (pre-dosing) and 24 hourly time points post-dosing. The purpose of this process was to reduce the amount of ambient noise from the background and hence reduce the unaccountable variability of the measurements.
For each post-dosing hourly time point, changes from baseline were derived for each animal in each dose group. Treatment effects of low dose, medium dose, and high dose of atenolol on QTcF, QTcP, or QTcI were compared to the control. For each QTc, a two-sided t-test with a significance level of 0.05 was employed for the comparison between each treatment group versus control. No multiplicity adjustment was made [9]. The p-values generated by the t-test were plotted against 0.05 for each treatment group.
Results
The data sets from Health an Environmental Sciences Institute contain QT, QTcF, and RR in 10-minute interval for 24 hours. Following the process of converting 10-minute intervals into hourly intervals as described in Statistical analysis section, figure 3 displays the derived hourly averaged QTcF over the 24-hour period for each of eight animals in lab 2 with different treatment groups. Preliminary analysis shows that there might not be any atenolol treatment effects over time. The QTcF seems to be similar across all treatment groups. This may indicate that atenolol does not have an effect on the QT interval in beagle dogs, or that Fredericaʼs correction formula is unfit for the QT interval in beagle dogs.
Figure 4 shows the vehicle control animal QT-RR relationship on a log-log scale along with the least-squares regression line for each animal. The slope estimate and its confidence interval for each animal are summarized in table 2, revealing that none of the intervals covers 1/3. This suggests that Fridericiaʼs correction factor is unsuitable for use in the correction of the QT interval in these two studies. Furthermore, the average of slope estimates in is 0.29 for Lab 1 and 0.23 for Lab 2, indicating that the Fridericiaʼs formula may be overcorrecting for the RR changes. The estimates of 0.29 and 0.23 are used to derive QTcP for animals in Lab 1 and Lab 2, respectively. The slope estimates listed in table 2 are used to derive QTcI for each animal.
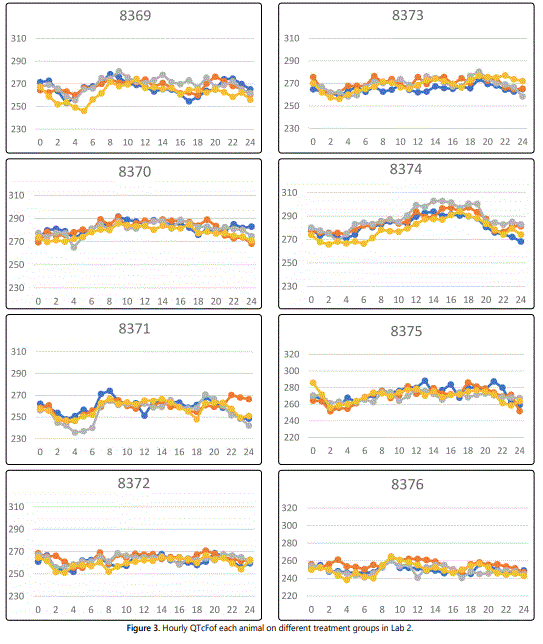
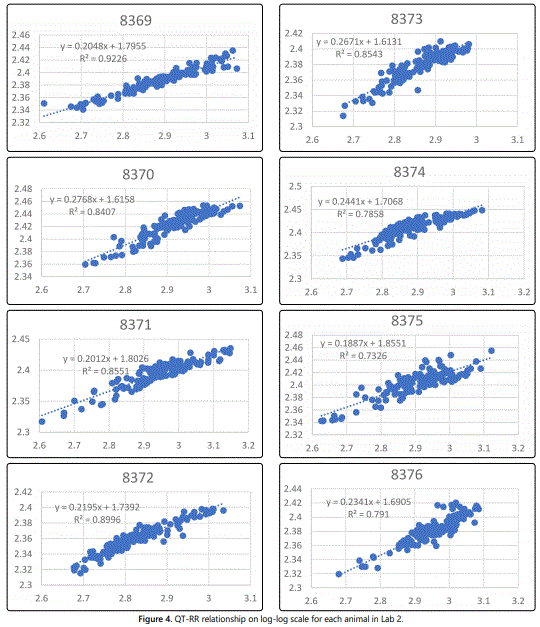

Figure 5 shows the changes from baseline for QTcF, QTcP, and QTcI from both Lab 1 and Lab 2. While there appears to be some difference in time profile between Lab 1, where most changes are negative, and Lab 2, where most changes are positive, the treatment group difference within each study is minimal. In addition, QTc changes from baseline over time appear to be consistent among QTcF, QTcP, and QTcI in Lab 1. For Lab 2, the longitudinal QTcF changes from baseline are different from QTcP and QTcI, where small increases are observed during the initial hours after dosing. It is noted that none of the change from baseline is above 10 ms, an area of potential clinical concern [1,9].
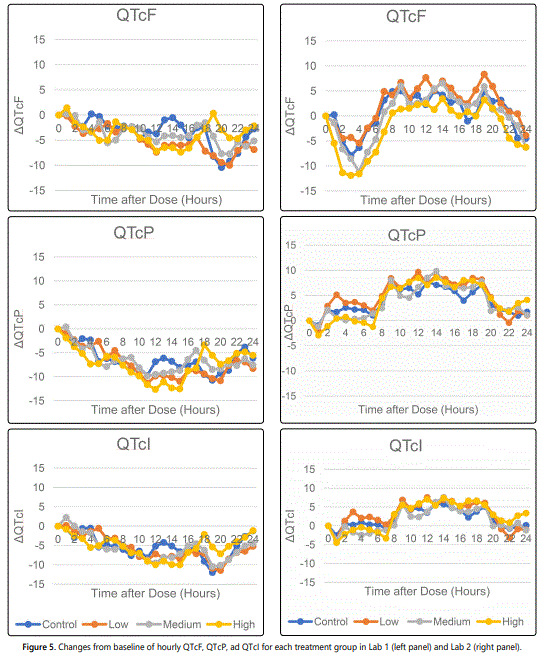
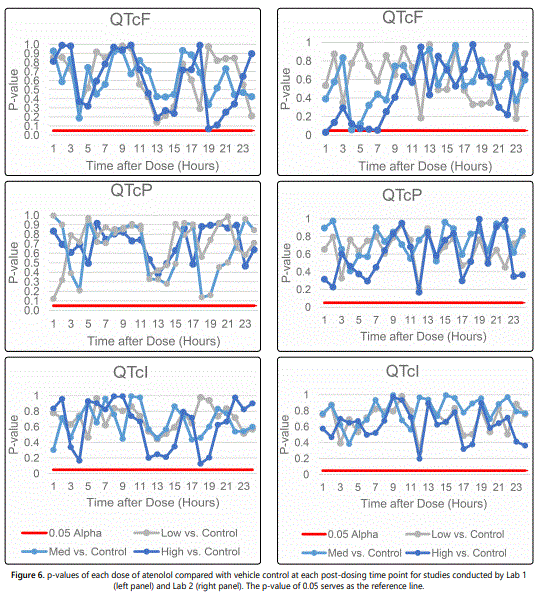
Figure 6 shows the p-value plots for evaluating the treatment effects of atenolol on QTcF, QTcP, and QTcI. The results indicate that the effect of atenolol on QTcF is statistically significant only at one time point, 1-hour post-dosing in the high dose group, only in Lab 2. The p-value was 0.031 and the group means change in QTcF between high dose and control was -5.7 ms. The effects of atenolol on QTcF are not statistically significant at any other time points. The use of QTcF to evaluate the treatment effect of atenolol is questionable because Fridericiaʼs correction factor is not appropriate in this study. The magnitude of changes in QTcF is found to be very different from that in QTcP and QTcI as shown in figure 5. In addition, the effect of atenolol is not found to be significant in QTcP, or QTcI from either laboratory.
Discussion and Concluding Remarks
The purpose of this study was to investigate the effect of atenolol on the QT interval in beagle dogs. Literature regarding the atenolol effect on QT is limited and the clinical use of atenolol to treat patients with long-QT syndrome has been inconclusive. Using the data from Health and Environmental Sciences Institute, our analysis concludes that atenolol results in no statistically significant QT changes in beagle dogs. These results have not been reported previously.
As heart rate plays a key role on the assessment of QT interval, we investigated whether the conventional Fridericiaʼs correction factor is adequate for use in beagle dogs. The goal of any QT correction for heart rate procedure is to reduce QT measurement error by effectively dissociating the effects of heart rate or RR, yielding a more stable measure, QTc. While other approaches to model the QT-RR relationship might be employed [8], we found the linear regression model on a log-log scale to be appropriate in our studies. In addition to a study-specific population-based correction factor, we also derived the animal-specific correction factor, analogous to the approach proposed by Malik et al. [7] for human. We concluded that Fredericaʼs formula was not adequate for beagle dogs in our studies as it tended to over-correct for RR.
The statistical evaluation of treatment effect was conducted by comparing the QTc changes from baseline from each atenolol group versus control. While there was a statistically significant QTcF difference at 1-hour post-dosing in Lab 2, it was clinically insignificant due to the very small difference between high dose atenolol and vehicle control (5.7 ms). Considering that there are no statistically significant changes from baseline in QTcP or QTcI, a plausible explanation for this outlier data point could be that Fredericaʼs correction may not be appropriate for beagle dogs, leading to inaccurate measurements and conclusions from the statistical analysis. The other possibility of this potential false positive finding is that there is no multiplicity adjustment made in the statistical analysis. If an underlined type I error is 0.05 and there are 24 independent hypothesis tests (24 hourly time points), the chance of observing a positive finding within the 24-hr period is 1-(1-0.05)24=0.708, i.e., there is an over 70% chance of having a statistically significant change at any time point even though the treatment effect is null. In practice, the 24 tests are not likely to be independent because of the time course dependent successive QT measurements. The significant finding in QTcF may also be attributed to the variability in heart rate, QT interval, animal handling or dosing procedure in Lab 2, or other sources of inherent error.
It is noted that the implications of this study may not be applicable to a human. Holzgrefe et al. [10] examines cross-species and human translation of QT prolongation induced by moxifloxacin. They show that all preclinical QT/QTc results are consistent when accurately modeled and evaluated, and the outcomes can be transferrable across species including man. Accurate translation of other drug-induced QT results remains limited and problematic. As a receptor blocker, atenolol binds to specific proteins that may be present in humans but not beagle dogs due to a medley of other possibilities that could explain an efficacy in humans but not beagle dogs. Further studies of atenololʼs clinical use in treating patients with long-QT syndrome are needed [5]. Finally, the study design with a sample size of eight in a Latin square design may be adequate for exploratory evaluation of atenolol effects on QT. The hope was that by repeating the experiments in two laboratories, inherent variability may be reduced and the conclusions are more conclusive. However, we recognize the data sets are limited and additional exploration is needed.
Acknowledgements
The authors wish to thank Health and Environmental Sciences Institute for the data, and Jack Knorr and Alan Chiang for their review and editorial comments of the manuscript.
References
- Goldenberg I, Moss AJ, Zareba W. QT interval: how to measure it and what is “normal”. J Cardiovasc Electrophysiol. 2006; 17: 333-336. doi: 10.1111/j.1540-8167.2006.00408
- Aby-Zeitone A, Peterson DR, Polonsky B, McNitt S, Moss AJ. Efficacy of different beta-blockers in the treatment of long QT syndrome. J Am Coll Cardiol. 2014; 64(13): 1352-1358. doi: 10.1016/j.jacc.2014.05.068
- Fitzgerald JD, Ruffin R, Smedstad KG, Roberts R, McAinsh J. Studies on the pharmacokinetics and pharmacodynamics of atenolol in man. Eur J Clin Pharmacol. 1978; 13(2): 81-89.
- Viitasalo M, Karjalainen J. QT intervals at heart rates from 50 to 120 beats per minute during 24-hour electrocardiographic recordings in 100 healthy men. Effects of atenolol. Circulation. 1992; 86: 1439-1442.
- Ackerman MJ, Priori SG, Dubin AM, et al. Beta-blocker therapy for long QT syndrome and catecholaminergic polymorphic ventricular tachycardia. Heart Rhythm. 2017; 14: e41-e44. doi: 10.1016/j.hrthm.2016.09.012
- Guth BD, Chiang AY, Doyle J, et al. The evaluation of drug-induced changes in cardiac entropy in dogs: results from a HESI-sponsored consortium. J Pharmacol Toxicol Methods. 2015; 75: 70-90. doi: 10.1016/j.vascn.2015.02.002
- Malik M, Färbom P, Batchvarov V, Hnatkova K, Camm AJ. Relation between QT and RR intervals is highly individual among healthy subjects: implications for heart rate. Heart. 2002; 87(3): 220-228.
- Luo S, Michler K, Johnston P, Macfarlane PW. A comparison of commonly used QT correction formulae: the effect of heart rate on the QTc of normal ECGs. J Electrocardiol. 2004; 37: 81-90.
- Holzgrefe H, Ferber G, Champeroux P, et al. Preclinical QT safety assessment: cross-species comparisons and human translation from an industry consortium. J Pharmacol Toxicol Methods. 2014; 69: 61-101. doi: 10.1016/j.vascn.2013.05.004

