Research Article
Genetic Diversity Analysis among Papaya (Carica papaya L.) Varieties using RAPD Markers
1Department of Biochemistry, University of Lucknow, Lucknow, India
2College of Basic Sciences and Humanities, Sardarkrushinagar Dantiwada Agricultural University, District-Banaskantha, Gujarat, India
*Corresponding author: Kusum Yadav, Department of Biochemistry, University of Lucknow, Lucknow, India, E-mail: anukusum@gmail.com
Received: March 7, 2019 Accepted: March 18, 2019 Published: March 26, 2019
Citation: Kumar D, Yadav P, Priyanka, Yadav A, Dwivedi UN, Yadav K. Genetic Diversity Analysis among Papaya (Carica papaya L.) Varieties using RAPD Markers. Int J Tradit Med Appl. 2019; 1(1): 22-27. doi: 10.18689/ijtma-1000105
Copyright: © 2019 The Author(s). This work is licensed under a Creative Commons Attribution 4.0 International License, which permits unrestricted use, distribution, and reproduction in any medium, provided the original work is properly cited.
Abstract
Papaya is one of the most important nutritional and medicinal fruit crops in the world. In this context, present study was aimed to analyse genetic diversity of 12 dioecious and gynodioecious varieties of papaya using 42 randomly amplified polymorphic DNA (RAPD) primers. Out of these 42 primers, 33 primers amplified 150 polymorphic bands with an average 4.54 polymorphic bands/primer. These 150 markers were used for estimation of Jaccard similarity coefficient which was in the range of 0.355 to 0.733. Two varieties namely Honey dew and Majestic showed highest similarity (0.733), followed by Surya and Vinayak (0.687) while Majestic and Mohini showed least similarity (0.355), followed by Ajeet and Mohini (0.381). This similarity matrix was used for cluster analysis using software Free Tree. In the UPGMA based dendrogram four distinct clusters were obtained in which one variety Mohini showed highest diversity with other varieties of papaya. Results of principal components analysis (PCA) was similar to that obtained by UPGMA clustering. Genetic diversity analysis obtained by these two methods showed that papaya cultivars and hybrids possess narrow level of genetic diversity.
Keywords: Carica papaya L; Genetic diversity; RAPD; UPGMA; PCA.
Introduction
Papaya (Carica papaya L.) is an economical and medicinally important fruit crop cultivated in tropical and subtropical regions worldwide. Whole part of papaya such as seeds, fruit, pulp, root and leaves has medicinal importance. It is used for the treatment of several diseases such as constipation, lower blood pressure, cancer, diabetes, arthritis, reduce inflammation, cardiovascular diseases, dengue and chickengunya. The use of papaya leaves increases the platelet count in dengue patients. Genetic diversity analysis is a prerequisite for planning of a breeding program for crop improvement. Papaya had its origins in South Mexico and in Central America. Gabriela Fuentes and Jorge M. Santamaria [1] and Solms-Laubach [2] suggested that papaya originated in Mexico. Some authors suggested that papaya originated in the North of South America [3,4]. It is widely distributed in the subtropical and tropical regions of the world now-a-days. Papaya belongs to family Caricaceae and comes under order Brassicales. The family is divided into six genera namely Carica, Jacaratia, Jarilla, Horovitzia, Cylicomorpha and Vasconcellea. Carica papaya the only species within the genus Carica [5,6]. The genus Jarilla comprises three species [7] and Jacaratia consists of seven species. Vasconcellea comprises 21 species, Cylicomorpha with two species and Horovitzia with one species [8].
Papaya has diploid genome (2n=18). Papaya fruit is rich source of vitamin A, vitamin C, potassium, folate, niacin, thiamine, riboflavin, iron, calcium and fibre [9]. A proteolytic enzyme, papain is produced by papaya plant which is commonly used in food processing and can also be used to treat digestion, reduce fever and in treatment of ulcers [10]. The small genome size, rapid development, and abundant production of the seed make papaya a valuable tree fruit model crop.
India is the top producer of papaya with 5.7 million tonnes among top five countries (Brazil Nigeria, Mexico, and Indonesia) [11]. However, one of the main problems with papaya is low genetic diversity of commercial genotypes due to which the plants become more susceptible to pests and diseases, which might decrease the fruit production for commercial purpose [12]. Several studies have been done to assess the genetic variability in papaya for their effective use in breeding programs and cultivar development. Earlier morphological markers have been utilized for evaluation of genetic diversity among papaya germplasm [13,14]. With the development of advanced molecular markers, many researchers started to analyse the genetic diversity of papaya using various types of molecular markers viz, restriction fragment length polymorphism (RFLP) [15] random amplification of polymorphic DNA (RAPD) [16,17], amplified fragment length polymorphism (AFLP) [18-21], inter simple sequence repeat (ISSR) [16,21], simple sequence repeat (SSR) [12]. Therefore, the present study was aimed to evaluate genetic diversity among papaya cultivars and its related wild species using RAPD markers.
Materials and Methods
Plant material
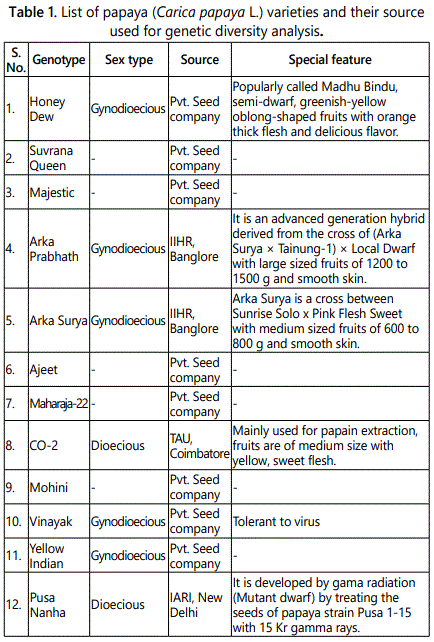
Seeds of twelve varieties of papaya were procured from various national institutes and private seed companies throughout India. Arka Prabhath and Arka Surya are gynodioecious varieties developed at Indian Institute of Horticulture Research (IIHR), Bangalore. Pusa Nanha is a dioecious variety developed at Indian Agricultural Research Institute (IARI), New Delhi. CO-2 was developed in Tamilnadu Agricultural University (TAU), Coimbatore. Some hybrid varieties developed by private seed companies (Honey Dew, Vinayak, Majestic, Ajeet, Mohini, Suvarna Queen, Yellow Indian, and Maharaja-22) have also been included (Table 1).
Genomic DNA isolation
Fresh young leaves of papaya plants were collected, washed under running tap water. Then the leaves were rinsed with 70% alcohol for 30 seconds followed by 3-4 times washing with distilled water. Then the leaves were dried and genomic DNA was isolated using HiPurATM Plant genomic DNA Miniprep Purification spin kit (Himedia Laboratories Pvt. Ltd, Bangalore) using the manufacturer's instructions. Quality and quantity of isolated DNA was checked by spectrophotometry as well as by 0.8% agarose gel electrophoresis.
PCR-RAPD analysis
PCR reaction was carried on each DNA sample in a 25 µl reaction mixture containing 2.5 µl Taq Buffer (1X), 2 µl MgCl2 (2 mM), 1.25 µl dNTPs (0.5 mM), 0.3 µl Taq polymerase (1 U), 2.5 µl primer (1 µM), 1 µl genomic DNA (25 ng) and 15.45 µl of sterile de ionized water. DNA amplification was performed in a thermal cycler (Bio-Rad, USA). RAPD-PCR reaction program is as follows: Preheat at 94°C for 5 minutes, followed by 35 cycles of denaturation at 94°C for 45 seconds, annealing at Tm-5°C for 25 seconds, extension at 72°C for 1 minute and final extension at 72°C for 5 minutes and then reaction was held at 4°C. The amplified PCR products were visualized on 1.2% agarose gel in 1X TAE buffer and gel images were recorded using gel documentation system (Bio-Rad, USA).
Data analysis
For comparative RAPD profiling, band positions of each genotype and primer were measured. This RAPD profiling was done only with those combinations of primers and genotypes which showed consistent bands after PCR amplification. The band score was assigned for unambiguous polymorphic markers; a score of ‘0’ was assigned for the absence of band and ‘1’ was assigned for presence of band. This data was used for calculation of Jaccard’s similarity coefficient using the Free-Tree software [22]. After this analysis, the resulted similarity matrix was used for Unweighted Pair Group Method with Arithmetic Mean (UPGMA) based dendrogram analysis using software NTSYSpc. Principal components analysis (PCA) was also performed for analysis of genetic diversity by NTSYSpc.
Results and Discussion
Polymorphism and marker efficiency
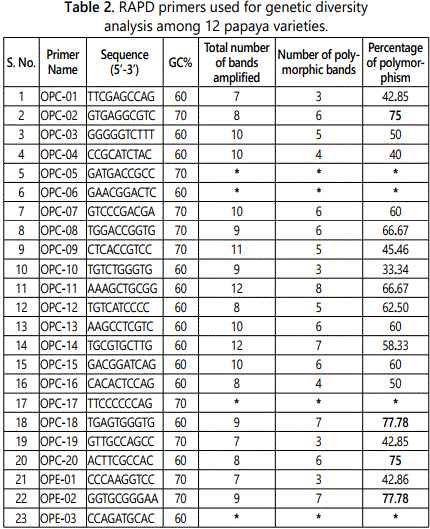
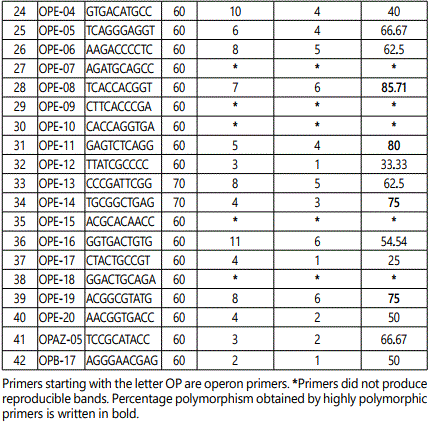
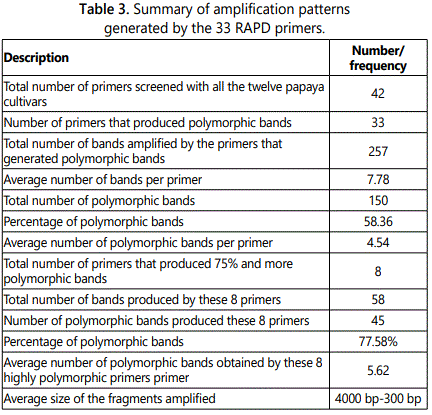
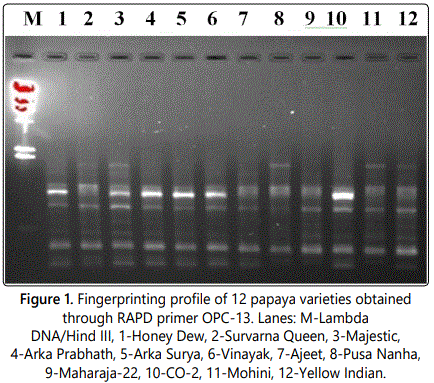
Out of the 42 primers used, 33 resulted in reproducible amplification patterns and amplified 150 polymorphic markers and the polymorphism was 58.36% (Table 2). The average of bands per primer was 7.78 while average polymorphic bands per primer were 4.54. Primers OPC-02, OPC-18, OPC-20, OPE-02, OPE-08, OPE-11, OPE-14 and OPE-19 were the highly informative primers as they showed 75% or more than 75% polymorphism. These eight highly polymorphic primers produced 77.85% polymorphism (Table 3). Gel image showing amplification profile with primer OPC-13 is shown in Figure 1.
In the present study we have obtained 58.36% of polymorphism which is higher than the previous study of genetic diversity of papaya using RAPD markers (25.5%) [13], 29.2% of polymorphism using ISSR markers [14], 42% using AFLP markers [17], 29.19% of polymorphism using ISSR markers [20] and 35% and 37.2% of the polymorphism using ISSR and RAPD markers, respectively [15]. The level of polymorphism obtained in this study is lower to that obtained in earlier study on papaya (84.32%) involving RAPD and ISSR markers [15]. Another study based on AFLP marker [19,20,23-26] also reported comparatively higher level of polymorphism (96.6% [26]; 66.08% [24]; 68.63% [19]; 69.58% [20]) in papaya. However, reports estimating lower polymorphism (27.5%) are also available [25].
Genetic diversity analysis
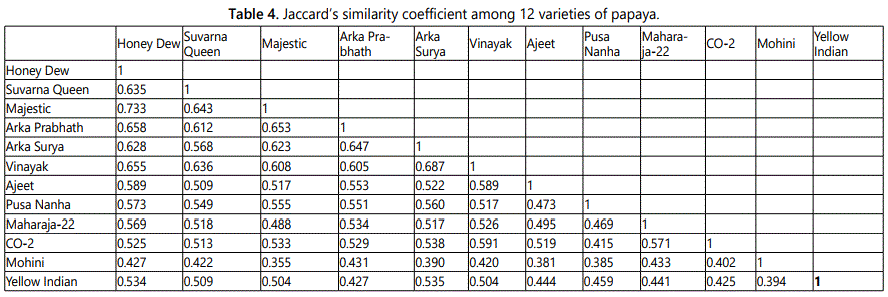
Data of 150 polymorphic markers were used for the genetic diversity analysis among 12 varieties of Carica papaya. Jaccard similarity coefficient between the genotypes was ranged from 0.355 to 0.733 (average 0.53). Lowest similarity was showed by Mohini and Majestic (0.355) followed by Mohini and Ajeet (0.381). Highest similarity was showed by Honey Dew and Majestica (0.733), followed by Surya and Vinayak (0.687) (Table 4). The range of Jaccard similarity coefficient is narrow and lower than the previous study in which moderate level of genetic diversity (the range of 0.30-0.99; average: 0.65 and 0.26-0.95; average: 0.61 using RAPD and ISSR, respectively) was obtained within papaya varieties [23]. RAPD analysis revealed only a moderate degree of genetic diversity among the cultivars examined in this study. However, the amount of papaya germplasm sampled in this study was small and weighted with Hawaiian cultivars. Simple matching coefficients ranging from 0.7 to 0.95 suggest a rather narrow genetic base for domesticated papayas [16]. In another study, the average pair wise genetic similarity was 0.880 and ranged from 0.741 to 0.978 were obtained using AFLP markers in papaya was narrow than the present study [17]. de Oliveira et al. [20] reported pair-wise estimates of similarity ranged from 0.328 to 0.942 in Carica papaya using AFLP markers which was the moderate level of genetic diversity. The Jaccard similarity coefficient values ranged from 0.28-0.806 which is the moderate level of genetic diversity than present study [13]. Jaccards similarity matrix was then used for cluster analysis and dendrogram (Figure 2) construction by using software NTSYSpc [26]. This UPGMA [27] based cluster analysis showed four clusters in the dendrogram. In the dendogram, twelve genotypes of papaya were grouped into four distinct clusters. Cluster I consisted of only Mohini which showed most divergence with others. Cluster II contained one variety namely Yellow Indian while cluster III contained eight genotypes included Ajeet, Pusa Nanha, Suvarna Queen, Arka Prabhath, Honey Dew, Majestica, Surya and Vinayak. Cluster IV contained two genotypes Maharaja-2and CO-2.
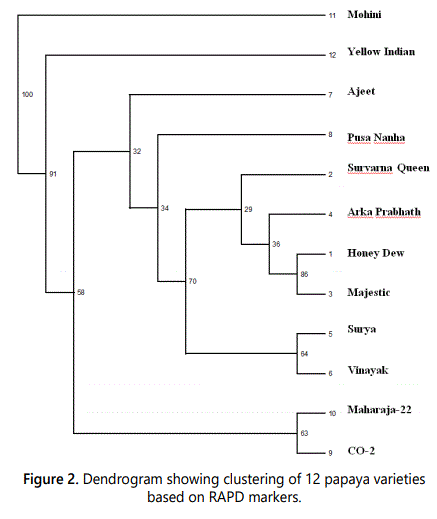
Bootstrap analysis of the dendrogram was also used to support the clusuters of dendrograms. There was the branch point that grouped all the papaya genotypes of into two cluster and at the branch Mohini and Yellow Indian had the bootstrap value 100 and 91 respectively.
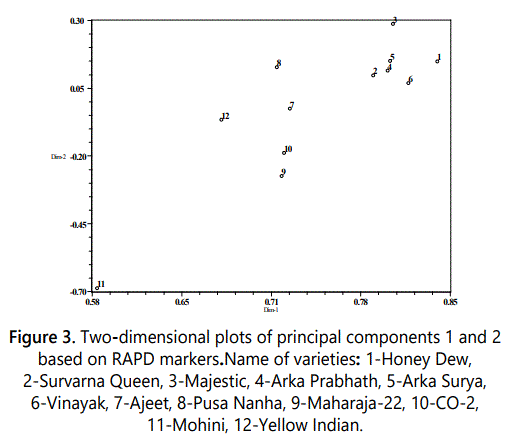
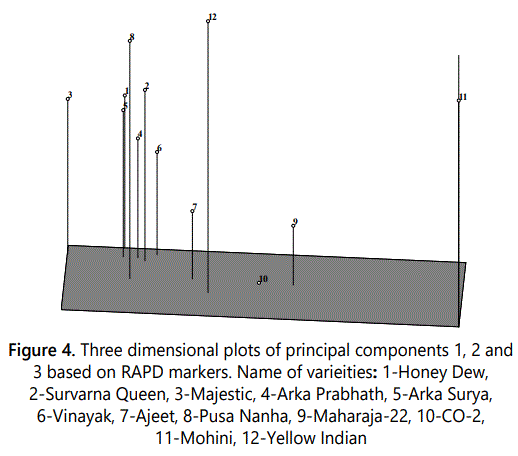
PCA was performed using 150 polymorphic RAPD markers. PC1, PC2 and PC3 accounted for 55.53%, 7.11% and 5.46% of variation, respectively. The cumulative variation of first three PCs was 68.10%. The contribution of first five PCs and first 10 PCs was 77.82% and 95.70% of total variability, respectively. The first two PCs were used for 2-dimensional plot (Figure 3) and first three PCs resulted in 3-dimensional plots (Figure 4). Although PCA did not result in clear cut clusters but the clustering pattern obtained in both 2-D and 3-D plots was similar to that obtained in dendrogram. As in dendrogram, Mohini variety was most distant from all other varities and separated as outgroup in both 2-D and 3-D plots. The clustering pattern of other 11 varieties of papaya in 2-D and 3-D plot was similar to that obtained in dendrogram. The variety Yellow Indian representing sole member of Cluster II of UPGMA also showed dissimilarity with other varieties in PCA 2-D and 3-D plots. Out of eight varieties namely Ajeet, Pusa Nanha, Suvarna Queen, Ark Prabhath, Honey Dew, majestic, Surya and Vinayak of cluster III of UPGMA dendrogram clustered together in PCA plots also except Ajeet and Pusa Nanha which shows dissimilarity therefore not clustered along with these six varieties. Two genotypes CO-2 and Maharaja-2 which formed cluster IV of dendrogram also grouped together in PCA 2-D and 3-D plots. Saran et al. [24] have performed PCA for genetic diversity analysis in papaya based on RAPD markers. The first and second PCs accounted for 31.18% and 18.15% of total variability, respectively. The first 10 PCs accounted for 98.79% of the total variability which is higher than that obtained in this study. Saran et al. [24] have also performed PCA in based on morphological traits and ISSR makers. In morphological sections, the first, second and third PCs accounted for 31.74%, 23.80% and 16.56% of total variability, respectively. The first 5 principal components accounted for 87.17% of the total variability and the first 10 principal components contributed 98.79% of the total variability. In ISSR based study, the first and second PCs accounted for 29.12% and 16.73%, respectively, of the total variation. In a previous study of papaya and its related plants, UPGMA dendrogram had been constructed using AFLP markers were classified into three main clusters. These clusters were supported by the PCA analysis in which similar cultivars were found in same group as in dendrogram clusters [15].
In the present study, we obtained narrow level of genetic diversity between the papaya varieties of India. The reasons for the narrow genetic diversity of C. papaya L. may be that the improvement in papaya species has not been done over the years with a large number of genotypes which may have contributed to this situation. Another reason for the low variability may be related to reproductive barriers resulting from incompatibility between the papaya genotypes and species from other genera of the family, creating a restricted gene pool [25]. Another previous study was performed between Indian Carica papaya accessions and the non-Indian Carica papaya accessions for inherent genetic diversity which resulted that Indian Carica papaya accessions produced more alleles per SSR marker (5.1 alleles/locus) as compared to those generated from the non-Indian Carica papaya accessions (3.5 alleles/locus) [28]. It means Indian papaya accession have more genetic diversity than the non-Indian papaya accessions.
Conclusion
RAPD marker was potential tools to detect polymorphism in papaya cultivars which allow for genetic diversity analysis. There is an urgent need to create more genetic diversity in papaya as in previous and present study obtained moderate and narrow genetic diversity.
Acknowledgements
The financial assistance in the form of research project sanctioned by Council of Science and Technology (CST), Uttar Pradesh, and Department of Science and Technology (DST), New Delhi, India; and research fellowships of Research Assistant (to Pramendra Yadav) by CST, Senior Research Fellowship (to Dileep Kumar) by University Grant Commission (UGC), New Delhi, Senior Research Fellowship (to Priyanka) by Department of Biotechnology (DBT), New Delhi are gratefully acknowledged.
References
- Fuentes G, Santamaria JM. Papaya (Carica papaya L.): Origin, Domestication, and Production. In: Ming R, Moore PH (eds). Genetics and Genomics of Papaya. Springer New York Heidelberg Dordrecht London. 2014; 10: 3-17.
- De Feo V, De Simone F, Arryo GA, Senatore F. Carica candicans Gray (Mito), an alimentary resource from Peruvian flora. J Agric Food Chem. 1999; 47(9): 3682-3684.
- Zanoni T, Mc Vaugh R, Anderson WR. Flora Novo-Galiciana: A Descriptive Account of the Vascular Plants of Western Mexico. Brittonia. 2006; 45(1): 95. doi: 10.2307/2806863
- Carvalho FA, Renner SS. Molecular Phylogenetics and Evolution : A dated phylogeny of the papaya family (Caricaceae) reveals the crop’s closest relatives and the family’s biogeographic history. Mol Phylogenet Evol. 2012; 65(1): 46-53. doi: 10.1016/j.ympev.2012.05.019
- Ming R, Hou S, Feng Y, et al. The draft genome of the transgenic tropical fruit tree papaya (Carica papaya Linnaeus). Nature. 2008; 452(7190): 991-996. doi: 10.1038/nature06856
- Aravind G, Bhowmik D, Duraivel S, Harish G. Traditional and Medicinal Uses of Carica papaya. J Med Plants Stud. 2013; 1(1): 7-15. doi: 10.1016/j.cclet.2010.09.004
- de Oliveira EJ, Amorim VBO, Matos ELS, et al. Polymorphism of Microsatellite Markers in Papaya (Carica papaya L.). Plant Mol Biol Rep. 2010; 28(3): 519-530.
- Madarbokus S, Ranghoo-Sanmukhiya VM. Identification of Genetic Diversity among Papaya Varieties in Mauritius using Morphological and Molecular Markers. Int J LifeSc Bt Pharm Res. 2012; 1(4): 153-163.
- Sudha R, Singh DR, Sankaran M, Singh S, Damodaran V, Simachalam P. Genetic diversity analysis of papaya (Carica papaya L.) genotypes in Andaman Islands using morphological and molecular markers. Afr J Agric Res. 2013; 8(41): 5187-5192.
- Van Droogenbroeck B, Kyndt T, Maertens I, et al. Phylogenetic analysis of the highland papayas (Vasconcellea) and allied genera (Caricaceae) using PCR-RFLP. Theor Appl Genet. 2004; 108(8): 1473-1486. doi: 10.1007/s00122-003-1575-7
- Kanupriya C, Shobhana M, Vasugi C, et al. Genetic relationship among papaya (Carica papaya) and wild papaya (Vasconcellea species) using RAPD and ISSR markers. Indian Journal of Agricultural Sciences. 2012; 82(4): 366-369.
- Stiles JI, Lemme C, Sondur S, Morshidi MB, Manshardt R. Using randomly amplified polymorphic DNA for evaluating genetic relationships among papaya cultivars. Theor Appl Genet. 1993; 85(6-7): 697-701. doi: 10.1007/BF00225007
- Kim MS, Moore PH, Zee F, et al. Genetic diversity of Carica papaya as revealed by AFLP markers. Genome. 2002; 45(3): 503-512.
- Van Droogenbroeck B, Breyne P, Goetghebeur P, Romeijn-Peeters E, Kyndt T, Gheysen G. AFLP analysis of genetic relationships among papaya and its wild relatives (Caricaceae) from Ecuador. Theor Appl Genet. 2002; 105(2-3): 289-297. doi: 10.1007/s00122-002-0983-4
- de Oliveira EJ, Costa JL, dos Santos LF, de Carvalho FM, Silva A dos S, Loyola Dantas JL. Molecular characterization of papaya genotypes using AFLP markers. Rev Bras Frutic. 2011; 33(3): 849-858.
- de Jesus ON, de Freitas JPX, Dantas JLL, de Oliveira EJ. Use of morphoagronomic traits and DNA profiling for classification of genetic diversity in papaya. Genet Mol Res. 2013; 12(4): 6646-6663. doi: 10.4238/2013.July.11.8
- Jaccard P. Nouvelles Researches Sur Ladistribution Flo-rale. Bulletin de la Sociète Vaudoise des Sciences Na-turelles. 1908; 44: 223-270.
- Saran PL, Choudhary R, Solanki IS, Patil P, Kumar S. Genetic variability and relationship studies in new Indian papaya (Carica papaya l.) germplasm using morphological and molecular markers. Turkish J Agric For. 2015; 39(2): 310-321. doi: 10.3906/tar-1409-148
- Ratchadaporn J, Sureeporn K, Khumcha U. An analysis on DNA fingerprints of thirty papaya cultivars (Carica papaya L.) grown in Thailand with the use of amplified fragment length polymorphisms technique. Pak J Biol Sci. 2007; 10(18): 3072-3078. doi: 10.3923/pjbs.2007.3072.3078
- Ramos HC, Pereira MG, Gonçalves LS, Berilli AP, Pinto FO, Ribeiro EH. Multivariate analysis to determine the genetic distance among backcross papaya (Carica papaya) progenies. Genet Mol Res. 2012; 11(2): 1280-1295. doi: 10.4238/2012.May.14.2.
- Rohlf FJ. NTSYSpc (Numerical Taxonomy & Multivariate Analysis System) Version 2.2, Exeter Software. Appl Biostatistics Inc. New York; 2005.
- Sneath PHA, Sokal RR. Numerical taxonomy. Nature. 1962; 193(4818): 855-860. doi:10.1038/193855a0
- Das B, Sengupta S, Prasad M, Acharyya P, Ghose TK. A comparative survey of genetic diversity among a set of Caricaceae accessions using microsatellite markers. Springer plus. 2013; 2(1): 1-10. doi: 10.1186/2193-1801-2-345

