Research Article
Improvement of the Dissolution Behavior of the Poorly Water Soluble Drug Diacerein by Solid Dispersion Technology and its Formulation into Tablet Dosage Form
Department of Pharmaceutics, Lachoo Memorial College of Science and Technology (Autonomous), Pharmacy Wing, Jodhpur, Rajasthan, India
*Corresponding author: Sourabh Jain, Lecturer, Department of Pharmaceutics, Lachoo Memorial College of Science and Technology (Autonomous), Pharmacy Wing, Jodhpur- 342003, Rajasthan, India, Email: jainbhu@yahoo.co.in
Received: August 11, 2018 Accepted: October 3, 2018 Published: October 12, 2018
Citation: Jain S, Nagori BP, Yadav SK. Improvement of the Dissolution Behavior of the Poorly Water Soluble Drug Diacerein by Solid Dispersion Technology and its Formulation into Tablet Dosage Form. Madridge J Nov Drug Res. 2018; 2(1): 79-89. doi: 10.18689/mjndr-1000112
Copyright: © 2018 The Author(s). This work is licensed under a Creative Commons Attribution 4.0 International License, which permits unrestricted use, distribution, and reproduction in any medium, provided the original work is properly cited.
Abstract
Diacerein (DAC) is an antiarthritic drug that shows almost negligible water solubility in acidic conditions and gets degraded at alkaline pH which restricts its oral bioavailability. The degradation product also leads to soft stool effect. The aim of the present study was to enhance the dissolution rate of DAC by solid dispersion (SD) technology and to incorporate the best SD formula (the one which is able to promote the highest drug release in minimum period of time) into tablet dosage form. Various binary (containing DAC and polyethylene glycols i.e. PEGs) and ternary (containing DAC, PEG and a pH modulating agent) SD formulations were prepared employing different process and formulation parameters. SDs so prepared were investigated for the dissolution behavior of DAC. The best SD formulation was characterized by aqueous solubility studies, XRD, ATR, SEM and DCS studies. A series of tablet dosage forms containing the best SD formula as the drug matrix was prepared using different concentrations of disintegrating agent. The best tablet (the one that allows the maximum disintegration in minimum period of time) was compared with the marketed preparation according to compendial specifications. All binary and ternary formulations increased drug dissolution rate. Dissolution studies show that there is a trend of increasing dissolution rate of DAC with decreasing molecular weight of PEGs as well as decreasing percentage of DAC in the SDs. Ternary SDs show higher dissolution in comparison to binary SDs, reflecting synergism of PEG4000 with urea. DAC solubility increased 3.39 times by the best SD formula. Physical characterization revealed the changes in solid state (decreased crystallinity) of DAC during the formation of SD. The best SD formula loaded tablet gave significantly higher dissolution compared to commercial product, which indicates its potential for delivering poorly water soluble drug DAC with enhanced bioavailability and reduced soft stool effects.
Keywords: Diacerein (DAC), Solid dispersion (SD), Polyethyleneglycol (PEGs), Urea.
Graphical Abstract

Introduction
The importance of the rate of dissolution and hence aqueous solubility, in acting as a determinant of oral absorption was formally recognized with the establishment of the Biopharmaceutics Classification System (BCS) [1], where, the active pharmaceutical ingredient (API) was classified into four categories based on its aqueous solubility and intestinal permeability. Classes 1 and 3 contain molecules with high aqueous solubility, and classes 2 and 4 contain molecules with low solubility. Interestingly, over the past few decades there has been a significant increase in the number of APIs under development that have fallen into BSC classes 2 and 4 because of solubility problems. These API molecules in the development process generally have larger average molecular weights, higher melting points and a higher degree of hydrophobicity. API molecules are generally introduced in their crystalline form into pharmaceutical development. This is primarily because the symmetrical three-dimensional long ranges order and the relatively tight packing of molecules in a crystal lattice which most often ensures a high level of chemical purity and solid-state stability. The high lattice energy of an API crystal can further decrease the solubility of already poorly soluble API. As a consequence, during the past few years, there have been significantly increased efforts to develop strategies that might serve to enhance the rate of dissolution of a poorly soluble API by means of formulation, chemical modification, or processing. It has been shown that disorder in the crystal lattice introduced as crystal defects can serve to improve dissolution performance of poorly water soluble, crystalline substances [2]. Consequently, it is not surprising that any approaches that can change, reduce, or eliminate the long range three-dimensional order in the crystal can greatly enhance apparent solubility and rates of dissolution.
SD technology is such an approach that can enhance rates of dissolution of an API by affecting both its crystallinity and specific surface area. It makes compounds disperse in carriers or matrixes at solid state and has been widely used as a successful approach to deliver insoluble compounds [3]. Although SD technique has been extensively confirmed to enhance the dissolution characteristics of the sparingly soluble drugs, the practical applicability of the system has remained limited mainly due to the difficulties in manufacturing process, such as poor reproducibility of physicochemical properties, the complexity of dosage form development, problems of aging and less feasibility of scale up for industrialization [4]. Therefore, more attempts about searching new carriers or combination of carriers and innovative techniques or modification of existing techniques, are needed to meet with above difficulties.
DAC (4,5-bis (acetyloxy)-9,10-dioxo-2-anthracene carboxylic acid) is a newly developed, oral, slow-acting drug for the treatment of osteoarthritis (OA). It has moderate antiinflammatory and analgesic activity, to about the same extent as non steroidal anti-inflammatory drugs (NSAIDs) and also reported to induces structural changes in studies of hip OA [5-7]. Though GI side effect, diarrhea, is commonly reported with DAC, however its use seems to minimize (or even avoid) the major GI concerns (pepticulcer) of NSAIDs [8,9]. Presently, DAC capsules are available in 50 mg strength and are marketed in various countries under various trade names as Art 50(R)® and Orcerine® in France and India respectively. Oral administration of conventional solid dosage form of DAC is associated with certain problems such as incomplete and erratic absorption which results in poor and variable oral bioavailability (35-56%) of DAC, mainly due to the poor water solubility of DAC. The unabsorbed DAC is metabolized to rhein in the colon which induces a laxative/ soft stool effect via activating chloride secretion by excitation of submucosal neurons and release of acetylcholine and endogenous prostaglandin, but not by release of histamine or serotonin [10]. Due to poor solubility, the generally administered oral dose is much higher to achieve the required drug plasma level which increases the cost of therapy. Therefore, there exists a need to develop newer formulations of DAC which can be administered orally, and are likely to dissolve at a higher rate leading to improved bioavailability and at the same time shows significant reduction in soft stool side effects.
This work is based on the investigation of solubility and dissolution properties of poorly soluble drug DAC with a view to improve its dissolution rate by SD technology and incorporation of the best SD formula in tablet dosage form, from which DAC will dissolve at a higher rate in comparison to the marketed formulation which has limited ability to dissolve in the gastro intestinal (GI) fluids.
To address this challenge, we focused on fusion technology to form SDs of DAC as this is a "green" production method that does not involve organic solvents. Early approaches involved binary formulations using PEGs as carrier. PEGs were chosen as carrier because in one of our investigation maximum solubility of DAC, in the co-solvents investigated, was found in PEG 600. Further PEGs have solubility parameter value (i.e. 24) [11], which is very close to the solubility parameter of DAC (i.e. 25.96, calculated using MolSuite software, ChemSW, California, United States), have good thermal stability, and have historically proven safety records. Once the best binary formulation was identified, other components (pH modulators) were added to further improve the dissolution properties of DAC in acidic conditions. DAC is a readily ionizable, weakly acidic drug with a pKa of 4.74, so its solubility in an aqueous solution is strongly pHdependent. It is comparatively less soluble at lower pH. Dissolution of DAC may further decrease the microenvironment pH inside the pharmaceutical solid dosage form and may decrease its own solubility and dissolution rate. pH modifiers (alkalizers) can be added to increase the microenvironment pH that can increase the release rate of DAC from the pharmaceutical dosage form. So a pH modulated solid dispersion of DAC can be developed to overcome the solubility and dissolution related issues. Sodium carbonate which is a commonly used alkali and urea which is a common carrier for SDs, increases both the pH of aqueous solutions and dissociation of weak acids [12,13], were explored for the development of pH modulated SDs of DAC.
Materials and Methods
Materials
DAC was obtained as a gift sample from Macleods Pharmaceuticals Ltd. (Mumbai, India). Polyethylene glycols grades 4000, 6000, 8000 and 20000 were purchased from Sigma-Aldrich (USA). Sodium carbonate was purchased from Loba Chemie Pvt. Ltd., (Mumbai, India). Urea was purchased from Ranbaxy Lab. Ltd. (Punjab, India). Marketed DAC capsule formulation, Orcerine®, was purchased from local market. All other chemicals and solvents used were of analytical grade.
Methods
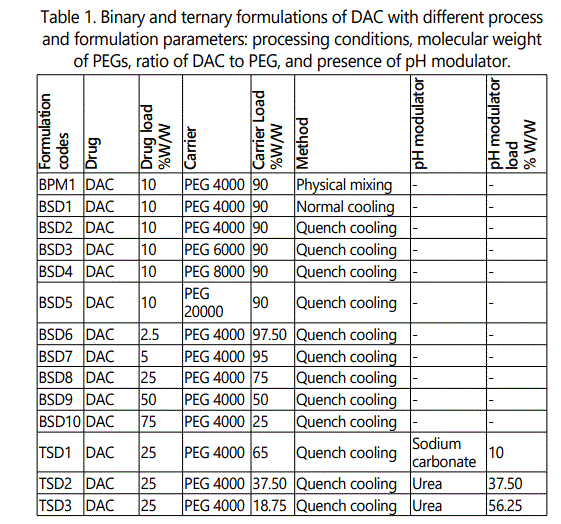
Total fourteen (eleven binary and three ternary) formulations of DAC were prepared using different process and formulation variables as shown in table 1. Process variables were:
1. Manner of formulation preparation (physical mixing and preparation of solid dispersion).
2. Manner of cooling in solid dispersion preparation (Normal cooling and quench cooling).
The formulation variables were:
1. Molecular weight of PEGs (4000, 6000, 8000, 20000),
2. Ratio of % DAC to % PEG (2.5: 97.5, 5: 95, 25: 75, 50: 50, 75: 25),
3. Presence of pH modulator (Sodium carbonate and urea) and
4. Ratio of % Urea to % PEG (37.50: 37.50, 56.25: 18.75). After preparation all the formulations were placed in vacuum desiccator over silica gel for at least one day before use.
Preparation of binary formulations
For the preparation of binary physical mixture (BPM1), DAC and PEG (previously triturated and passed through sieve no. 44) were weighed and gently mixed for 5 min using a mortar and spatula. For the preparation of binary SDs (BSD1- BSD10), weighed amount of carrier i.e. PEG was taken in a China dish, heated on steam bath till it melted completely. PEG melt was combined with the weighed amount of DAC and triturated with the help of a small glass pestle to make a homogenous dispersion. The China dish was removed from steam bath and cooled in two ways i.e.
1. The melted mixture was triturated at room temperature continuously till the mixture solidifies completely (normal cooling, BSD1).
2. The China dish was immediately put into the crushed ice bath, and the mixture was triturated continuously till it solidifies completely (quench cooling, BSD2- BSD10).
Preparation of ternary formulations
For the preparation of ternary SD containing sodium carbonate (TSD1), weighed amount of PEG 4000 was melted in a China dish by heating on a steam bath; weighed amount of sodium carbonate was added into melted PEG 4000 and triturated. Water was added drop wise till homogenous dispersion of PEG 4000 and sodium carbonate forms. Weighed amount of DAC was added and triturated to make a homogenous dispersion. The resultant mixture was solidified by quench cooling.
For the preparation of ternary SDs containing urea (TSD2- TSD3), weighed amount of urea was melted in a China dish using a glycerin bath, weighed amount of PEG 4000 was added into melted urea. When PEG 4000 and urea were mixed completely, weighed amount of DAC was added and mixture was triturated with the help of a pre heated small glass pestle to make a homogenous dispersion. The resultant mixture was solidified by quench cooling.
Determination of Drug Content
To determine the content of DAC in various binary and ternary formulations, accurately weighed quantity of finely powdered formulations, equivalent to 50 mg DAC, was mixed with 5 ml dimethyl sulfoxide and made up the volume 50 ml with methanol in a volumetric flask. The volumetric flasks were sonicated for 30 min to affect complete dissolution. The dispersions were filtered through 0.45 μm filters, suitably diluted with distilled water and analyzed by taking the absorbance readings on a UV/VIS spectrophotometer (Shimadzu Corp, Japan, model: UV-1800 with UV Probe software) at 342 nm.
In-vitro Dissolution Studies
Dissolution tests were performed using USP dissolution test apparatus Type II (Electrolab Dissolution Tester USP model TDT 06L, India). 900 ml of distilled water was used as a dissolution medium for binary SD formulations. The best binary SD formulation and subsequently developed ternary SD formulations were studied using 900 ml of 0.1 M HCl containing 2% sodium lauryl sulphate (SLS) (pH 1.2) as the dissolution medium. The dissolution medium was set at 37.0 ± 0.5°C and the paddle speed of 75 rpm was used. The prepared formulations were passed through sieve no. 44 (triturated, if required) to control the particle size range. The samples equivalent to 50 mg of DAC (based on formulation composition) were used for dissolution experiments. Aliquots (5 ml each) were drawn from the dissolution media at regular intervals and replaced with equal amounts of the blank dissolution medium. The withdrawn samples were passed through a 0.45 μ membrane filter and analyzed by taking the absorbance readings on a UV/VIS spectrophotometer (Shimadzu Corp., Japan, model: UV-1800 with UV Probe software). All the dissolution tests were performed in triplicate (n=3, mean ± SD).
Dissolution studies were performed under nonsink conditions, as nonsink conditions are more discriminating than the sink condition, since the ability for a formulation to maintain supersaturation can only be tested under nonsink conditions [14]. The formulation which is able to promote the highest drug release in minimum period of time was selected as best SD formulation (i.e. TSD2).
Comparison of solubility of the selected SD formulation TSD2 with pure DAC
In order to determine the DAC solubility, an excess amount of pure drug or the formulation TSD2 were weighed and added to 25 ml of distilled water. Samples were kept on magnetic stirrer and stirred at 1000 rpm till equilibrium was achieved. At predetermined intervals, aliquots were withdrawn, filtered through 0.45 μm filters, suitably diluted and analyzed by taking the absorbance readings on a UV/VIS spectrophotometer at 342 nm [15].
Solid state characterization of selected SD formulation TSD2
Differential scanning calorimeter (DSC)
Differential scanning calorimeter (Perkin Elmer, USA) was used to study the thermal transitions in DAC and the formulation TSD2. Pure DAC and the formulation TSD2 were accurately crimped in aluminium pans and heated from 30 to 380°C at an increment of 10°C/min under nitrogen atmosphere.
Powder X-ray diffractometry (PXRD)
PXRD was performed to evaluate the crystalline variability of DAC and the formulation TSD2, using a PXRD diffractometer (Bruker-D8 advance, Germany). The patterns were recorded with Cu Kα radiation (λ=1.54056 Å) as X-ray source, operated at a current of 40 mA in the range of 2θ = 10-80°.
Scanning electron microscopy (SEM)p The shape and surface morphology of pure DAC and the selected best SD formulations (i.e. TSD2) were studied using SEM (SEM, EVO18 special edition, Carl Ziess). Samples were mounted on metal stubs and were observed for morphology, at an acceleration voltage of 20 kV.
Attenuated total reflectance spectroscopy (ATR)
Powdered samples of pure DAC, PEG 4000, urea and the selected best SD formulation TSD2 were analyzed by using an ATR spectrophotometer (Bruker, ALPHA-E/T) to check the possible interactions of the DAC with the PEG 4000 and/or urea in the SD formulation TSD2. The scanning range was between 4000 and 400 cm-1.
Preparation and characterization of SD based tablets
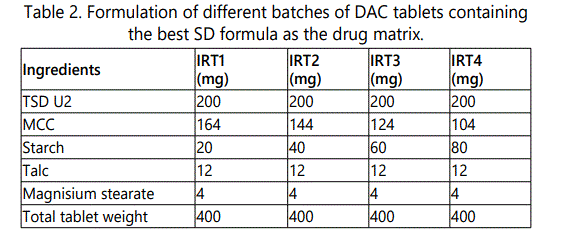
The selected best SD formulation TSD2 was formulated into tablets by using four different concentrations of starch as disintegrant. Four different types of tablet dosage forms containing 200 mg of the SD formulation TSD2, equivalent to 50 mg DAC, were prepared according to the formulation design depicted in table 2, by direct compression. The respective powders, namely the SD formulation TSD2, microcrystalline cellulose and starch were passed separately through sieve no. 44. Mixing of powders was carried out using a pestle and mortar for 10 min. Talc and Magnesium Stearate were then added to the mixed powders. Mixing was continued for another 3 min. Finally, each formulation was compressed using 1.2 mm, biconcave punches on a rotary tablet press (CPMD3-10, Chamunda Pharma Machinery Pvt. Ltd., India). Various properties (i.e. hardness, uniformity of weight and disintegration time) of the prepared tablets were tested [16]. The tablet dosage form that allows the maximum disintegration in minimum period of time was selected as best tablet dosage form (i.e. ITR4).
Dissolution profile comparison of the selected tablet ITR4 with the marketed preparation (Orcerine®, 50 mg Diacerein)
For the comparison of dissolution profile of the selected best tablet dosage form (ITR4) with those of marketed DAC capsule formulation (Orcerine®), in-vitro dissolution studies were performed as described in section In-vitro Dissolution Studies using conditions given in IP 2010 (Paddle apparatus, dissolution medium 900 ml of citrate buffer pH 6, temperature 37.0 ± 0.5°C, paddle speed 75 rpm). Samples were analyzed by taking absorbance on UV/VIS spectrophotometer at 344 nm. All the dissolution tests were performed in triplicate.
Results and Discussion
Percentage drug content
Percentage drug content of the binary and ternary formulations was found to be in the range of 97.05 ± 3.31 (w/w) to 102.51 ± 1.65 (w/w). In case of TSD1 discoloration (reddish-brown) of mixture takes place. As sodium carbonate was not dissolved in liquefied PEG 4000, there was need of addition of water to make a homogenous dispersion of sodium carbonate in melted PEG 4000, so discoloration in TSD1 formulation may be attributed to added water and sodium carbonate which gave an alkaline aqueous solution having high temperature (i.e. 53 to 56°C, which is the melting range of PEG 4000) [17], in which DAC degrades. Though the formulation TSD3 does not contain added water but contain relatively higher amount of urea. As the melting point of urea is high, it solidify at a very fast rate when pestle is used to triturate them and it becomes difficult to get a homogenous mass, on the other hand increasing the temperature, in an attempt to get a homogenous mass, leads to discoloration of the product. Thus the process became uncontrollable as the amount of urea was increased. So these two formulations (TSD1 and TSD3) were not investigated further.
In-vitro dissolution studies
Influence of the processing conditions
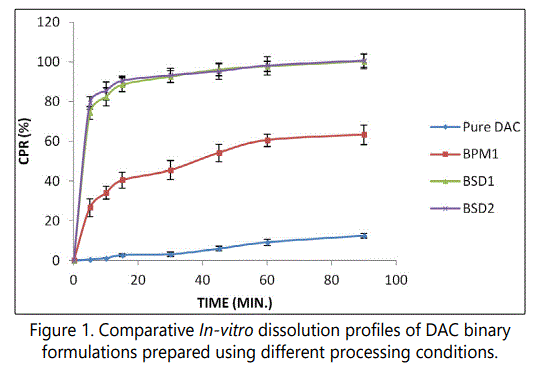
Figure 1 shows the in-vitro dissolution profiles of pure DAC, its physical mixture with PEG 4000 (BPM1) and the corresponding SDs prepared using normal cooling (BSD1) and quench cooling method (BSD2). Untreated DAC exhibited a relatively very slow dissolution rate, in which only about 3% drug was dissolved within the first 15 min and only about 13% of the loaded drug was dissolved after 90 min. These results can be ascribed to the fact that during dissolution testing, drug particles were found floating on dissolution medium even at the end of test, which were visually observed. It shows poor wetting property of DAC. The simple mixing of DAC with PEG 4000, effectively improved the drug dissolution rate. In physical mixture formulation BPM1, about 40% and 63% of the drug was dissolved within the first 15 min and 90 min respectively. PEG 4000 encircling the DAC, decreases aggregation and agglomeration of DAC particles and causes water to contact and wet the DAC particles and so increase its dissolution rate. Furthermore, the dissolution rate of binary SDs (BSD1 and BSD2) increased significantly compared to the physical mixture (Similarity factor f2=16 and 15 respectively), but almost similar dissolution profiles were observed for SDs, BSD1 and BSD2, prepared by normal cooling and quench cooling respectively (Similarity factor f2=73). Interestingly these findings are different than those reported in literature [18], where SDs prepared by cooling at room temperature, had a low dissolution in comparison to the SDs prepared by quench cooling. This might be attributed to the cooling at a very low temperature in case of reported results and the continuous trituration used during solidification in the present investigation, which is not there in the case of reported results. Continuous trituration also leads to faster solidification of the melt. The figure 1 shows that about 90% DAC were dissolved from the SD formulations, within the first 15 min. The dispersion of the DAC in the PEG 4000 matrices caused a pronounced enhancement of DAC dissolution rate. The increase in dissolution rate by SDs might be due to the improved wettability, increase of the specific surface, the change in solid state of DAC in SDs and solubilization effect of the carrier. Though quench cooling doesn't significantly increase the dissolution rate of DAC in comparison to normal cooling but it was still decided to choose quench cooling method in rest of the experiments, because of slightly higher dissolution rate observed, and because it avoids variability of room temperature.
Influence of PEG molecular weight
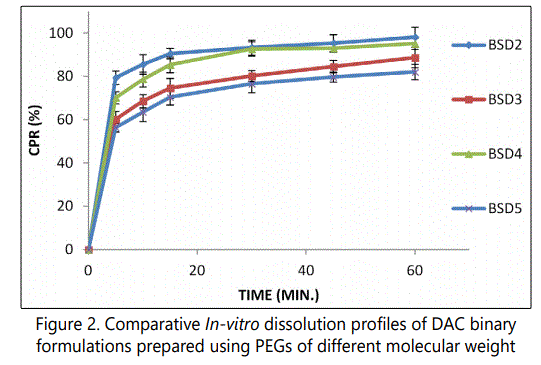
Figure 2 shows the in-vitro dissolution profiles of binary SDs of DAC with PEGs of different molecular weights (formulations BSD2, BSD3, BSD4 and BSD5) prepared using quench cooling method. The binary SDs of DAC with PEGs effectively improved the drug dissolution rate. The dissolution of the DAC from the formulation BSD2 at the end of 15 min was 90.55%, which are 1.22, 1.06 and 1.29 fold higher than the formulations BSD3, BSD4 and BSD5 respectively (which show 74.52%, 85.35% and 70.41 % drug release respectively at the end of 15 min). Table 3 shows the f2 values for comparison between in-vitro dissolution of DAC from SDs prepared using PEGs of different molecular weights. In comparison to BSD2, the f2 values of the products BSD3 and BSD5 was found to be less than 50 (38 and 33 respectively), which is a sign of dissimilarity between dissolution profiles. It explains a significant improvement in dissolution profile of DAC from SDs with PEG 4000 when compared to the SDs with PEG 6000 and PEG 20000. On the other hand the f2 value of the product BSD4 was found to be greater than 50 (i.e. 57), which is a sign of similarity between dissolution profiles. One of reasons of low dissolution rate of BSD5 may be the fact that the formed product has softer/ waxy consistency due to which it can't be converted to powder form, and the sample used for dissolution studies remained in a lump form which was submerged in dissolution medium, which was visually observed. The results indicate the trend of decreasing dissolution rate of DAC with increasing molecular weight of PEGs with the exception of BSD3 (PEG 6000) which shows lower dissolution rate then BSD4 (PEG 8000). An earlier study of phenylbutazone/PEGs SDs also indicated that the drug release is dependent on the PEG molecular weight. Further, in this study, also the PEG 6000 shows anomalous behavior of least dissolution among the investigated PEGs (1500>4000>20000>6000) at drug loading of 3% and more [19]. According to these results PEG 4000 seems to be the better carrier in comparison with PEG 6000, 8000 and 20000 because of higher dissolution rate observed with SD samples prepared using PEG 4000. That is why; it was decided to choose PEG 4000 as carrier in rest of the experiments.

Influence of drug load
Figure 3 shows the in-vitro dissolution profiles of DAC-PEG 4000 SD containing different percentage of DAC (BSD6, BSD7, BSD2, BSD8, BSD9 and BSD10) and prepared by quench cooling method SD containing very low concentration (i.e. ≤ 5%) of DAC i.e. BSD6 and BSD7 exhibited a very high dissolution rate, in which more than 90% DAC was dissolved within the first 10 min. The dissolution rate of DAC decreases with the increasing drug load. These results can be attributed to the increasing proportion of poorly soluble crystalline form of DAC in the resultant product and the decreasing amount of PEG 4000 which became insufficient to encircle the increasing amount of DAC, particularly above 50% load of DAC.
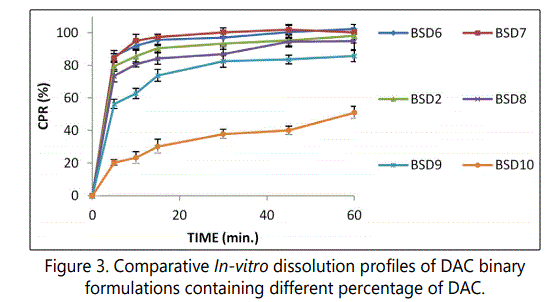
Table 4 shows the f2 values for comparison between in-vitro dissolution of DAC from SDs prepared using different percentage of DAC. In comparison to BSD2, the f2 values of the products BSD9 and BSD10 was found to be less than 50 (34 and 11 respectively), which is a sign of dissimilarity between dissolution profiles. It explains a significant improvement in dissolution profile of DAC from SDs with drug load of 10 % when compared to the SDs with drug load of 50% and 75%. On the other hand the f2 value of the product BSD8, with drug load of 25%, was found to be greater than 50 (i.e. 63), which is a sign of similarity between dissolution profiles. So lower drug load, resulted in improved dissolution of DAC from the resultant product, but lower the drug load, bigger will be the size of resultant formulation, which may be difficult to administer. Though the drug load upto 50% gives satisfactory dissolution but by keeping the stability of the product and size of drug product in mind BSD8 was chosen for further investigations.

Influence of dissolution medium on dissolution of DAC from the formulation BSD8
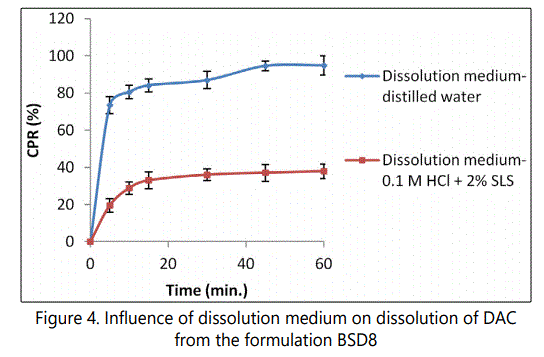
Figure 4 shows the comparision of in-vitro dissolution profiles of the formulation BSD8 in distilled water and 0.1 M HCl containing 2% SLS (pH 1.2) as dissolution medium. Though the formulation BSD8 exhibited a high dissolution rate of DAC in distilled water, in which more than 80% drug was dissolved within the first 10 min but the same formulation shows a comparatively very slow dissolution in 0.1 M HCl containing 2% SLS (pH 1.2), in which less than 40% drug was dissolved even after completion of 60 min. The f2 values of the formulation BSD8 in distilled water in comparison to 0.1 M HCl containing 2% SLS (pH 1.2) was found to be 14 (less than 50), which is a sign of dissimilarity between dissolution profiles. These results are in complete agreement with the pH dependent solubility of DAC, which show decreasing solubility with decreasing pH. So to improve the dissolution of DAC in acidic pH, addition of pH modulator in binary SD was investigated.
Influence of addition of urea in binary SD formulation
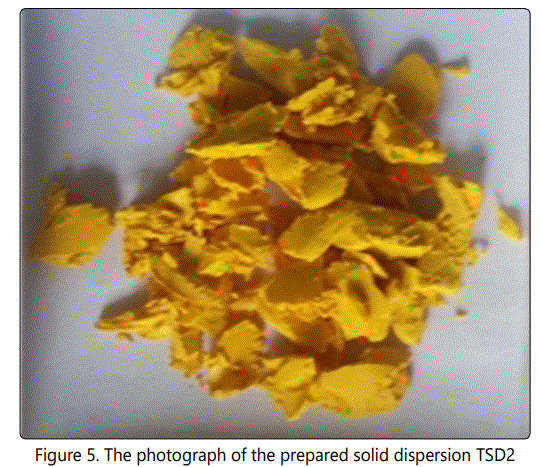
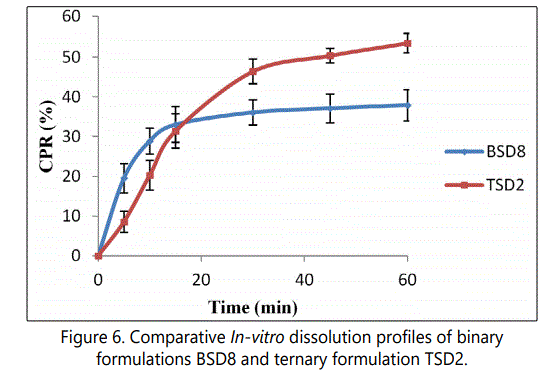
The addition of urea in the DAC-PEG 4000 SD lead to formation of ternary SD (TSD2) with softer/waxy consistency at room temperature (Figure 5), which are difficult to convert to powder form by trituration. Addition of urea at 37.5% level leads to increased dissolution of DAC in 0.1 M HCl containing 2% SLS (pH 1.2). In the ternary formulation TSD2 the initial release of DAC was slow in comparison to the binary formulation BSD8 (Figure 6). This can be attributed to softer/ waxy consistency and lack of powder form in case of ternary formulation TSD2, which remained in lump form which was submerged in dissolution medium, which was visually observed. In comparison to the binary formulation BSD8, the f2 values of the ternary formulation TSD2 was found to be 48 (less than 50), which is a sign of dissimilarity between dissolution profiles. It explains a significant improvement in dissolution profile of the ternary formulation TSD2 when compared to the binary formulation BSD8, so TSD2 it was selected as best SD formulation.
Comparison of solubility of the selected SD formulation TSD2 with pure DAC
The results of solubility studies indicated that the DAC have poor solubility in distilled water (6.74 × 10⁻² mg/ml). Significant improvement (3.39 folds) in solubility of DAC was achieved by formulating it as ternary SD formulation TSD2 which has 22.84 × 10⁻² mg/ml DAC solubility in distilled water. The increased solubility of DAC in the ternary SDs could be due to complexation, increased pH and/or supersaturation.
Solid state characterization of selected SD formulation TSD2
Differential Scanning Calorimetry (DSC)
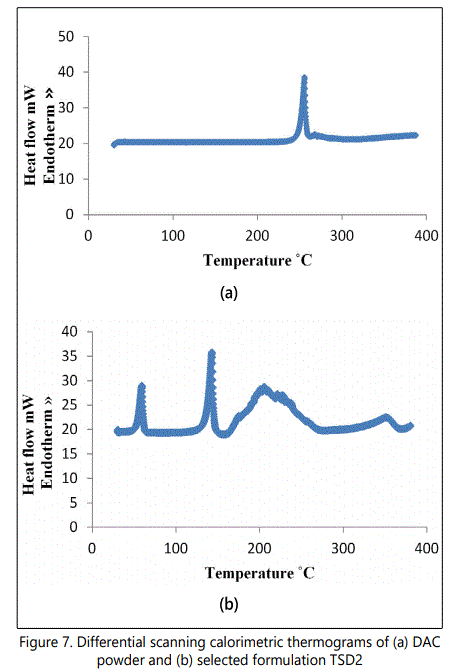
DSC thermograms of DAC powder and the selected best formulation TSD2 are shown in figure 7. The thermo grams of DAC powder show the sharp endothermic melting peak of DAC at 255.33°C, corresponding to the melting point of the crystalline form of DAC. The thermogram of the selected best formulation TSD2 shows two sharp endothermic peaks at 58.69°C and 142.55°C which may be attributed to fusion of PEG 4000 and urea respectively. The thermogram of formulation TSD2 doesn't shows the sharp endothermic melting peak of DAC at 255.33°C, which is present there in the thermogram of DAC powder, which is indicative of absence or change in crystalinity of DAC, rather the thermogram shows a broad endothermic peak of low intensity at 205.69°C which may be attributed to the thermal degradation of urea to biuret and cyanic acid. The peak at 350.66°C might be due to the further degradation of already degraded products of urea.
Powder X-Ray Diffractometry (PXRD)
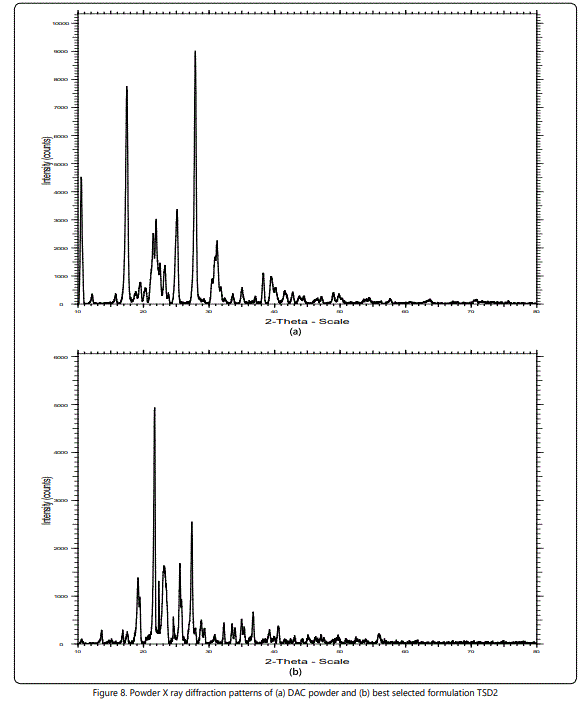
Figures 8a and 8b shows the PXRD crystallograph of DAC and the selected best formulation TSD2 respectively. Powder X-Ray Diffraction (PXRD) studies helps in confirming the results suggested by the DSC studies. The diffraction patterns of pure diacerein shows sharp peaks indicating the crystalline state of pure DAC [20]. TSD2 shows the presence of characteristics peaks of urea and PEG 4000, and the absence or much reduced intensity of the characteristics peaks of DAC suggesting that the drug present might be in its amorphous form.
Scanning Electron Microscopy (SEM)
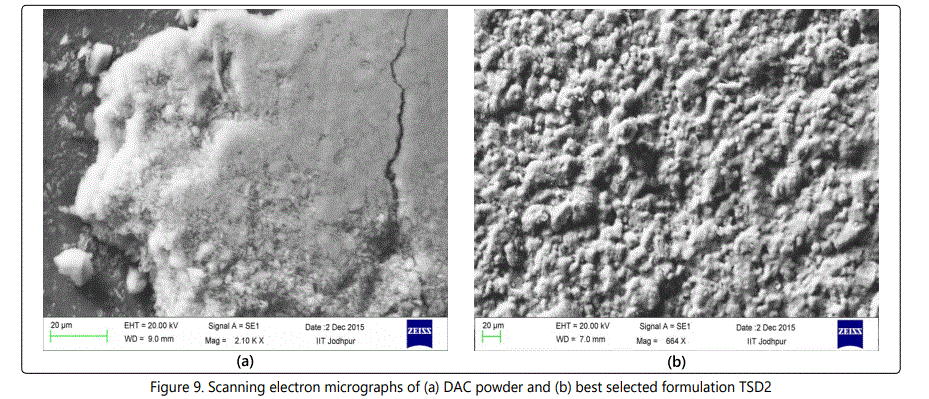
SEM studies were performed to study the characteristics and surface morphology of DAC and the SD formulation TSD2. Figures 9a and 9b shows the SEM spectra of DAC and the selected best formulation TSD2 respectively. The SEM pictures for the drug DAC shows the crystalline nature of the drug. The images for the SDs reveal structures that look like aggregated pieces of sphere which seems porous and has a comparatively large surface area.
Attenuated total reflectance spectroscopy (ATR)
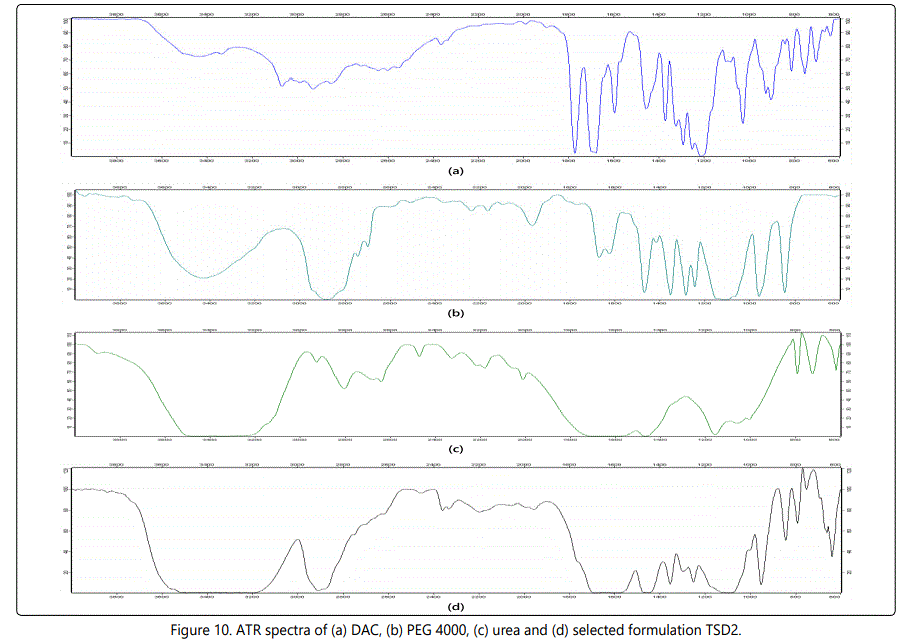
ATR spectroscopic analysis was carried out to assess any possible interactions between DAC, PEG 4000 and urea. Figures 10a-10d shows the ATR spectra of DAC, PEG 4000, urea and the selected formulation TSD2 respectively. The spectrums (a), (b) and (c) shows the characteristic peaks of pure DAC, PEG 4000 and urea respectively. The spectrum of pure DAC shows the characteristic peaks at 1210 cm−1 (for C–O stretches of acetate group), 1679 cm−1 (for stretching of the carbonyl group of the carboxylic group), 1690 cm−1 (for stretching of the carbonyl groups of the benzoquinone ring) and 1769 cm−1 (for two carbonyl groups of the acetate groups). In the case of PEG 4000, peaks were observed at 3420 cm−1 (O–H stretching) and at 2890 cm−1 (C–H stretching). While for urea, characteristic peaks were observed at 3360 cm−1 (N–H stretching) and 1668 cm−1 (C=O stretching). In the formulation TSD2, all of the characteristic peaks for the DAC, PEG 4000 and urea are overlapped and show no substantial shifting of the positions of the characteristic peaks indicating the absence of major interactions between these compounds.
Characterization of SD based tablets
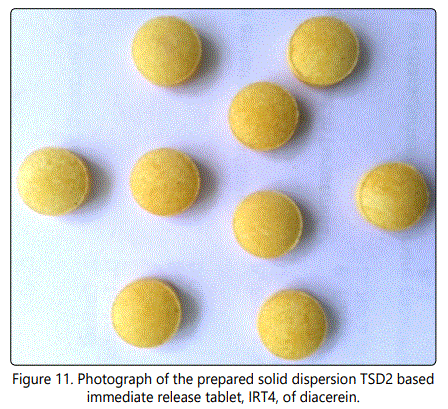
All the formulations of prepared tablets exhibited uniformity of weight (data not shown). Hardness was found in the range of 3-3.5 Kg/cm2 . Increasing amount of starch leads to decrease in in-vitro disintegration time (Table 5) and the formulation ITR4 have the least disintegration time i.e. 6 min, so ITR4 tablet dosage form (Figure. 11) was selected as best tablet dosage form.

Dissolution profile comparison of the selected tablet ITR4 with the marketed preparation (Orcerine®, 50 mg Diacerein)
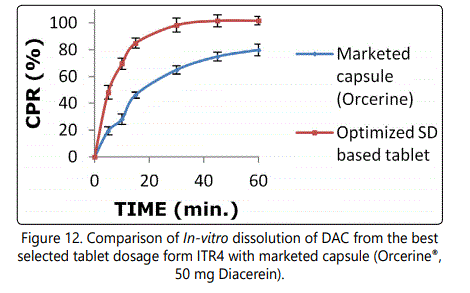
The in-vitro dissolution profiles of DAC from test product i.e. ITR4 tablets and reference product i.e. commercially available marketed capsule (Orcerine®, 50 mg Diacerein) are shown in figure 12. Both the formulation complied with the dissolution specification, D, stated in the I.P. 2010 [16], as dissolution not less than 75% of the labeled amount of DAC within 45 min. The developed tablet dosage form showed a higher dissolution rate of DAC (about 85% dissolved at 15 min and almost complete dissolution at 30 min) compared to the marketed capsule form (75.84% dissolved at 45 min and complete dissolution don't occur even at the end of 1 hr). The value of similarity factor f2 between the reference and test product were found to be 22 which ensure difference of the two products. Such enhancement in dissolution rate is well documented when using SD as formulation technique [21], wherein the altered, more soluble physical form of drug rather than the poorly soluble crystalline form which is found in the conventional tablet dosage form, leads to enhancement in dissolution rate.
Conclusions
Binary and ternary SDs composed of poorly water-soluble drug DAC were successfully obtained through fusion technique. The enhancement of the biopharmaceutical properties of the DAC was achieved for all formulations, although the best results were attributed to the ternary formulations TSD2 composed of DAC/PEG4000/UREA at a weight ratio of 25/37.5/37.5 respectively. This SD formulation was able to significantly improve the dissolution rate and also the aqueous drug solubility (by 339%). All of the solid-state characterization techniques demonstrated the altered solid state of DAC in the developed ternary SD TSD2. ATR data verified the absence of interaction of the DAC with PEG 4000 and urea. Unlike other conventional SD systems, DAC loaded ternary SD does not use any organic solvent, used a lower ratio of carrier to drug and prepared by simpler processing steps which offers a number of economical and environmental advantages and the relative ease of scaling up the process. Furthermore, ternary SD loaded IR tablets gave significantly higher dissolution compared to commercial product, which indicates its potential for delivering poorly water soluble drug DAC with enhanced bioavailability and reduced soft stool effects. These results highlight the future perspectives for these systems, especially for the optimized ternary SD, which include the obtainment of floating dosage forms (to further improve the bioavailability as the drug absorb preferentially in the upper part of GIT) and the determination of their bioavailability compared with commercial formulations.
Acknowledgement
The authors wish to thank Macleod's Pharmaceuticals Ltd., Mumbai, India for providing DAC samples, for research work. The authors also wish to thank IIT, Jodhpur, India for analyzing the samples on its DSC, XRD and SEM facilities.
References
- Amidon GL, Lennernäs H, Shah VP, Crison JR. A theoretical basis for a biopharmaceutic drug classification: the correlation of in vitro drug product dissolution and in vivo bioavailability. Pharm Res. 1995; 12(3): 413-420. doi: 10.1023/A:1016212804288
- Liu R. Water-Insoluble Drug Formulation. 2nd Edition. Taylor & Francis Group, CRC Press, an Informa group company. 2008.
- Dong Z, Chatterji A, Sandhu H, Choi DS, Chokshi H, Shah N. Evaluation of solid state properties of solid dispersions prepared by hot-melt extrusion and solvent co-precipitation. Int J Pharm. 2008; 355(1-2): 141-149. doi: 10.1016/j.ijpharm.2007.12.017
- Murali Mohan Babu GV, Prasad ChD, Ramana Murthy KV. Evaluation of modified gum karaya as carrier for the dissolution enhancement of poorly water-soluble drug nimodipine. Int J Pharm. 2002; 234(1-2): 1-17. doi: 10.1016/S0378-5173(01)00925-5
- Spencer CM, Wilde MI. Diacerein. Drugs. 1997; 53(1): 98-106.
- Fidelix T, Macedo CR, Maxwell LJ. Diacerein for osteoarthritis. Cochrane Database. 2006.
- Dougados M, Nguyen M, Berdah L, Mazieres B, Vignon E, Lequesne M. Evaluation of the structure-modifying effects of diacerein in hip osteoarthritis: ECHODIAH, a three-year, placebo-controlled trial. Evaluation of the Chondromodulating Effect of Diacerein in OA of hip. Arthritis Rheum. 2001; 44(11): 2539-2547.
- Smith GN, Myers SL, Brandt KD, Mickler EA, Albrecht ME. Diacerhein treatment reduces the severity of osteoarthritis in the canine cruciate deficiency model of osteoarthritis. Arthritis Rheum. 1999; 42(3): 545-554. doi: 10.1002/1529-0131(199904)42:3<545::AID-ANR20>3.0.CO;2-4
- Felisaz N, Boumediene K, Ghayor C, Herrouin JF, Galerra P. Stimulating effect of diacerein on TGF-beta1 and beta2 expression in articular chondrocytes cultured with and without interleukin-1. Osteoarthritis Cartilage. 1999; 7(3): 255-264. doi: 10.1053/joca.1998.0199
- Gao D, Wu JS, Lu WS, Chen S, Kuo PC, Chen CM. Pharmaceutical composition containing diacerein. US 2010/0104651A1. TWi Biotechnology Inc. 2010; 4: 29.
- Zografil G, Newman A. Introduction to amorphous solid dispersions. In: Gad SC (ed). Pharmaceutical Amorphous Solid Dispersions. 1st edition, John Wiley & Sons, Inc. 2015. doi: 10.1002/9780470571224.pse522
- Scientific F. Material Safety Data Sheet: Urea. Fisher Scientific Fair Lawn, NJ. 2008.
- Bull HB, Breese K, Ferguson GL, Swenson CA. The pH of urea solutions. Arch Biochem Biophys. 1964; 104(2): 297-304. doi: 10.1016/S0003- 9861(64)80017-5
- Zhao Y, Xin T, Ye T, Yang X, Pan W. Solid dispersion in the development of a nimodipine delayed-release tablet formulation. Asian Journal of Pharmaceutical Sciences. 2014; 9(1): 35-41. doi: 10.1016/j.ajps.2013.11.006
- Riekes MK, Kuminek G, Rauber GS, de Campos CE, Bortoluzzic AJ, Stulzera HK. HPMC as a potential enhancer of nimodipine biopharmaceutical properties via ball-milled solid dispersions. Carbohydr Polym. 2014; 99: 474-482. doi: 10.1016/j.carbpol.2013.08.046
- I.P. Indian Pharmacopoeia Vol. I & II. The Controller of Publication, New Delhi; 1996: 762-10. Vol II. 6th Edition ed. Ghaziabad: The Indian Pharmacopoeia Commission. Ministry of health and family welfare, Government of India. 2010.
- No authors. Technical data sheet 279. PEG 4000, EM Grade. Polysciences Inc.1991; 10: 1.
- Urbanetz NA. Stabilization of solid dispersions of nimodipine and polyethylene glycol 2000. European journal of pharmaceutical sciences. 2006; 28(1-2): 67-76. doi: 10.1016/j.ejps.2005.12.009
- Ford JL, Stewart AF, Dubois JL. The properties of solid dispersions of indomethacin or phenylbutazone in polyethylene glycol. Int J Pharm. 1986; 28(1): 11-22. doi: 10.1016/0378-5173(86)90142-0
- Dabre R, Jain GK, Estanove C, Sandal R, Mandaogade P, Nakhat P. Rhein or diacerein compositions. EP2471516 A2. 2011; 6(4).
- Dressman J, Leuner C. Improving drug solubility for oral delivery using solid dispersions. Eur J Pharm Biopharm. 2000; 50(1): 47-60. doi: 10.1016/S0939-6411(00)00076-X
