Research Article
Linear Optical Constants of Polyvinylidene Fluoride/Praseodymium oxide Nanocomposite films in the Ferroelectric Phase
1Department of Physics, Chemistry & Mathematics, Alabama A&M University, Huntsville, AL, USA
2Department of Physics, Sree Kerala Varma College, Thrissur, Kerala, India
*Corresponding author: Kuzhivelil Joseph Arun, Researcher, Department of Physics, Sree Kerala Varma College, Kerala, India, E-mail: drarunkj@gmail.com
Received: November 05, 2021 Accepted: December 07, 2021 Published: December 13, 2021
Citation: Arun KJ, Batra A, Sampson J, Kassu A, Aggarwal MD. Linear Optical Constants of Polyvinylidene Fluoride/Praseodymium oxide Nanocomposite films in the Ferroelectric Phase. Madridge J Nanotechnol Nanosci. 2021; 5(1): 179-184. doi: 10.18689/mjnn-1000134
Copyright: © 2021 The Author(s). This work is licensed under a Creative Commons Attribution 4.0 International License, which permits unrestricted use, distribution, and reproduction in any medium, provided the original work is properly cited.
Abstract
In the present investigation, the pristine and Praseodymium oxide (Pr2O3) nanoparticle embedded polyvinylidene fluoride (PVDF) thick films were fabricated via solution casting/intercalation technique. PVDF/ Pr2O3 nano composite film has been fabricated aiming its use in ferroelectric memory devices and in the development of biomedical sensors. The Pr2O3 nano particles were synthesized by the hydrothermal technique, being a versatile and easy method for obtaining size controlled nanoparticles. The Fourier Transform Infrared Spectroscopy (FTIR) has been recorded in the range 400 to 4000 cm-1, and functional groups were identified in the nanocomposite films. Infrared vibrational spectroscopy (FTIR + Raman) curves revealed the presence of ferroelectric β-phase in the annealed nanocomposite films intrinsically. All-important optical constants have been determined for the first time via UV-VIS transmission spectroscopy for the nanocomposite films in the ferroelectric phase.
Keywords: PVDF; Praseodymium oxide; Nanocomposite; Solution casting.
Introduction
Functional ferroelectric materials are called ‘smart materialsʼ due to their respective unique properties. Thus, they can be configured to store, release, or interconvert electrical and mechanical energy in a well-controlled manner. They have exceptionally large piezoelectric compliances, pyro electric coefficients, dielectric susceptibilities, and electro-optic properties. They are attractive for a variety of applications such as high energy density capacitors, actuators, sensors, ultrasonic imaging, pyroelectric thermal imaging devices, gate insulators in transistors, electro-optic light valves, thin-film memory elements, multiferroic transducers, energy harvesters, etc. Polyvinylidene fluoride (PVDF) is exploited in a wide range of devices due to its excellent mechanical properties, optical, high thermal and chemical stability, piezoelectric, pyroelectric, and ferroelectric responses.
Electroactive polymers (EAPs) are gaining an immense interest as smart materials [1,2]. There are many EAPs, namely, Nylon-11, polylactide and aniline pentamer copolymer, poly (lactic-co-glycolic acid) (PLGA), and poly (vinylidene fluoride) (PVDF) and its copolymers with trifluoroethylene (TrFE) [3-6]. However, PVDF and PDVF-TrFE exhibit the best electro active properties, such as piezo-, pyro- and ferroelectricity, and optoelectronic [7,8]. As a result, PVDF and its copolymers are of choice for the increasing number of possible organic microelectronics applications, such as electro-optic transducers, waveguides, sensors, actuators, energy harvesting, electro-optic memory, biomimetic robotics [9]. With respect to the carbon atom in the unit, the hydrogen atoms are positively charged, and the fluorine atoms are negatively charged. The repeat unit of (– CH2–CF2) or CH2CF2) n, in which the carbon-hydrogen bonds with the electrically polar carbon-fluorine, can take up several stable configurations determined by the treatment of the polymer. PVDF can be crystallized into at least four different polymorphous phases, depending on the film preparation conditions. Two forms β (or I) and α (or II)-are of particular importance. In form α, PVDF is non-piezoelectric, the bonds are in a trans-gauche-trans-gauche configuration, and the molecules are stacked, giving a nonpolar unit cell. The α phase can be converted into form β by stretching and electrically poling with a suitable field. In form β, the molecular groups are in an all-trans configuration, and the molecules are assembled to give a polar unit cell. Form β is orthorhombic with point group Amm2. In the recent past, PVDF has attracted interest in the photonics area because of the possibility to be used as hosts for lanthanides photonics ions [10].
Praseodymium oxide nanorods were prepared by the hydrothermal synthesis method. Hydrothermal process has several advantages over other fabrication processes such as the use of simple equipment, catalyst-free growth, low cost, large area uniform production, environmental friendliness and is less hazardous. The particle properties such as morphology and size can be controlled via the hydrothermal process by adjusting the reaction temperature, time and concentration of precursors. However disadvantages include safety concerns in operating the autoclaves under high pressure at the reaction temperatures and the impossibility of observing the formation of nano crystals during the reaction process.
In designing the emerging optical devices and sensors, the variation of all the standard basic parameters and constants with photon energy are warranted and justified to be investigated. However, limited works can be found in the literature about the study of the complete optical properties of PVDF pristine and nanocomposite films in UV-VIS range. Thus, this publication presents all the important optical constants, including optical band gap of about 100μm thickfilms of pristine PVDF and Pr2O3 embedded PVDF films.
Experimental
Fabrication of the nanoparticle and films
In this study, 0.1 molar solution of Praseodymium chloride is mixed with 0.1 molar solution of Sodium hydroxide. The water used in this reaction was doubly distilled and deionized. By this method pH value of the solution was adjusted to 9. After stirring the colloidal reaction solution, it was transferred into an autoclave made up of Teflon lined stainless steel. Then the solution is subjected to heat at 300°C for 6 hours in an oven and subsequently cooled down to room temperature. The settled particles were collected and washed repeatedly with deionized water under vacuum. Praseodymium hydroxide nanoparticles were heated at 80°C. Hydroxide nanorods were turned into oxides after heating to a temperature of 300°C. Annealing of the sample to a temperature of 700°C was also conducted. It was found that annealing results in a change in color, which is an indication of the change in particle. 500 mg of PVDF was dissolved in 20 ml of DMF under vigorous stirring at 60°C for the complete dissolution of PVDF in DMF. Then a certain weight percentage of the Praseodymium oxide nanoparticles were added to the PVDF solution and vigorously stirred for one hour to obtain a homogeneous mixture. The nanocomposite films were prepared by casting the mixture in a properly cleaned and dried petri dish, and the solvent was evaporated at 90oC in the oven. 1wt%, with 2wt%, 3wt%, 4% and 5wt% Praseodymium oxide nanoparticles loaded PVDF films were prepared. They were coded as PrO50; PrO100; PrO150; PrO200 and PrO250 respectively, including pristine PrO0.
Optical characterization
Raman spectral analysis in the range from 250-2250 cm-11 was carried out by using a Raman spectroscopy system (Enwave Optronics Inc.) operating at 785nm laser wavelength. The optical transmittance in UV-Vis region on the samples was recorded using Hitachi U-2900 (2J1-002) dual-beam spectrophotometer in the wavelength range of 200-800 nm. The surrounding medium was air, and all the measurements were performed at room temperature. The measured transmittance (T) was used to calculate the absorption coefficient (α) using the formula
α= (2.303 log (1/T))/t (1)
Where, t is the thickness of the sample. It is known that, if multiple reflections are neglected, the reflectance R of the sample can be calculated from the measured values of the transmittance T and absorbance A using the following equation
R=1-(T+A) (2)
The refractive index (n) of the material was calculated from reflectance values using the expression
n= (1+R2)/ (1-R2) (3)
The optical conductivity is one of the powerful tools for studying the electronic states in the material and is related to the absorption coefficient (α) and the refractive index (n) by the following relation:
Optical Conductivity= αnc/4π (4)
Where c is the speed of light.
The optical density is related to absorption coefficient (α) and thickness (t) of the sample by:
Optical Density=α*t (5)
The variation of extinction coefficient (k) with wavelength (λ) can be obtained from the equation
k=αλ/4π (6)
Results and Discussions
From the recorded Fourier Transform Infrared (FTIR) and Raman spectra in the range, 500 to 4000 cm-1 and functional groups were identified in the nanocomposite films (Figure 1). Fourier transform infrared (FTIR) absorption spectra of pristine PVDF and Pr2O3 nanoparticle incorporatedPVDF films shows characteristic peaks at 840 cm-1, 1074 cm-1, 1178 cm-1 and 1400 cm-1 corresponding to the intrinsic IR bands of PVDF [11]. It can be clearly seen from the figure that all the characteristic absorption bands corresponding to nonpolar a phase of PVDF are gradually diminished with increasing filling fraction of Pr2O3 nanoparticles in PVDF and the relative intensities of the peaks corresponding to the electroactive phase has been increased considerably confirming that the material can be effectively employed for technical applications in the field of biosensors and ferrolectric devices. Raman spectra provides informations on the the conjugated structure and chain skeleton of polymers. Moreover, it provides bands of lower wave number as readily as bands of higher wave number. Thus, Raman data provides more spectroscopic information than provided by FTIR analysis alone. It is worth mentioning the note-worthy result that the Raman bands at 836 cm-1 and 1429 cm-1 show the presence of ferroelectric β phase in PVDF and nanocomposite films, which is intrinsically present in as grown and composite films without poling. The variation in Raman intensities observed in the spectra at different compositions can be attributed to the formation of more β phase in the nanocomposites on incorporation of Pr2O3. It is a promising indicator of the enhanced ferroelectric property of the material.
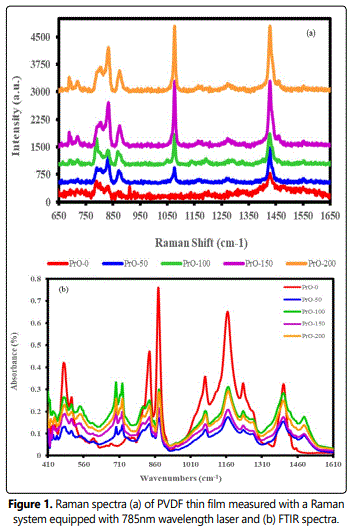
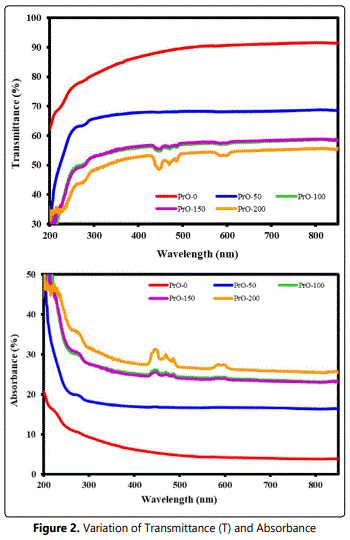
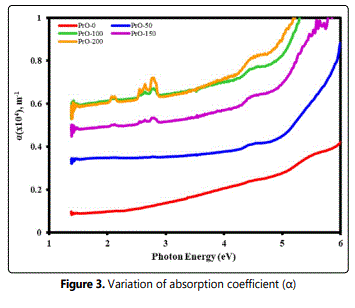
Figure 2(a) demonstrates the transmittance of pure and PVDF/PrO nanocomposite. The transmittance for pure PVDF is higher than PVDF/PrO nanocomposite. The transmittance shows more decrement in the UV region than in the visible region. The effect of adding PrO nanoparticles is evident; they have a very low transmittance in UV region that decreased with increasing content of PrO in nanocomposite films. This may be due to nano heterogeneities created in nanoparticle reinforced PVDF films. Furthermore, possibilities of enhanced scattering in UV region can be ruled out that will create increase in reduction of the transmittance with increase in concentration of embedded PrO nanoparticles. Figure 2(b) demonstrates the UV-visible absorption spectra of pure and nanocomposite films. The absorption spectrum of pure PVDF is partial in the UV region, but it is enhanced when PrO nanoparticles are embedded, which has high band gap. Figure 3 shows the absorption coefficient ‘α’ as a function of Photon energy. It can be seen that the absorption coefficient increased with an increased concentration of PrO nanoparticles.
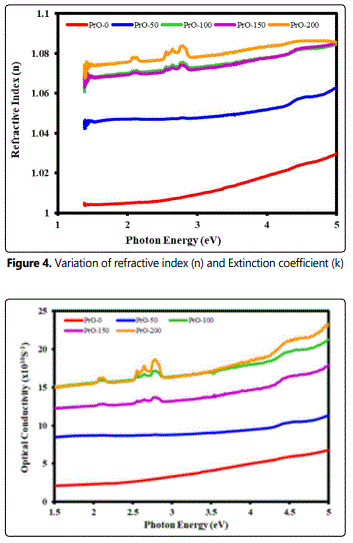
The complex refractive index is the representation of the optical constants of material and in represented by n* = n + ik. The real part ‘n’ is the index of refraction, defines the phase velocity of light in material: v = c/n, where v is the speed of light in materials, and c is the speed of light in vacuum. The imaginary part ‘k’ is the extinction coefficient, determines how fast the amplitude of the wave decreases. The variation of ‘n’ decreased with an increase in the photon energy of the incident beam (Figure 4). The refractive index increased with the increase in the loading of PrO nanoparticles in the films. This may be due to a change in density and/or the polarization in the film with an increase in the concentration of PrO nanoparticles.
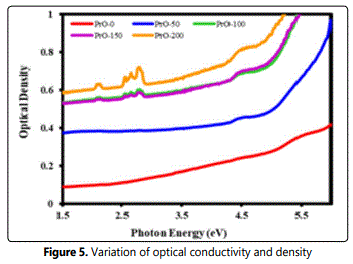
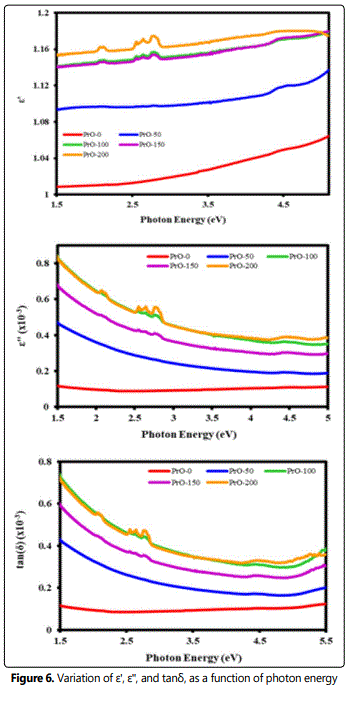
The optical conductivity is one of the powerful tools for studying the electronic states in materials. The plots between the optical conductivity (O.C.) and optical density (O.D.) against photon energy are depicted in Figure 5. The spectrum indicates that optical conductivity increases with the increase of photon energy Figure 5. The behavior of optical density (O.D) is similar to the variation of O.C. with photon energy in pure PVDF film. The dielectric function (εT = ε' + iε'') is a complex quantity and a fundamental intrinsic property of the material which consists of both the real and imaginary parts (ε' and ε''). The real part indicates how the speed of light in the material can be slowed down while the imaginary part deals with the absorption of energy by a dielectric from the electric field due to dipole motion.
From the optical dielectric curve (Figure 6), it is evident that ε' and ε'' increase with an increase of photon energy. The calculated dielectric loss tangent (tanδ) of the films represents the depletion of the electrical energy [12,13]. The study of the absorption edge is essential in connection with the theory of electronic structure, which leads to the prediction of whether the band structure is affected near the band extreme. So the main aim is to determine the magnitude and the nature of the optical energy band gap of pure PVDF thin film. The optical energy gap of the material is determined by the absorption spectra. According to the Tauc relation, the absorption coefficient α for the material is given by
Αhν=A (hν−Eg) n (10)
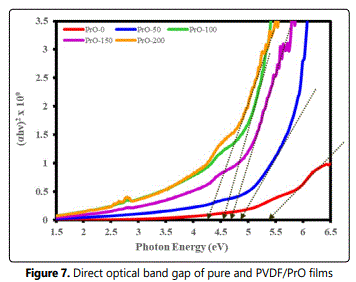
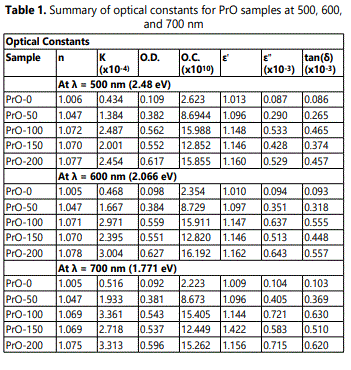
Where, Eg is the optical energy gap; A, is a constant and is different for different transitions; hν, is the energy of the photon, and n is an index which assumes the values 1/2, 3/2, 2, and 3 depending on the nature of electronic transitions responsible for absorption. Thus the band gap is obtained by plotting (αhν)n versus hν in the high absorption range followed by extrapolating the linear region of the plots to (αhν)n. This indicates the allowed direct transition is responsible for the inter-band transition in the doped crystal. Figure 7 shows the plot of (αhν) 2, against photon energy hν for the pristine PVDF and PrO nano composites films. The values of optical band gaps (Eg) for films for (αhν) 2 were found to decrease with the increase of concentration of Pr2O3 nanoparticles in PVDF films. Table1 summarizes various optical parameters as a function of the wavelength of UV-VIS radiation.
Conclusion
Homogeneous nanocomposite PVDF films with good optical quality has been fabricated and the optical constants, such as the direct optical band gap (Eg), absorption coefficient (α), refractive index (n), extinction coefficient (k), were calculated to analyze the optical properties of the films. Vibrational spectral analysis confirms that electro active beta phase has considerably increased on nanoparticle loading. Variation of optical conductivity, optical density with wavelength is studied. The refractive index was found to increase with an increase in the concentration of PrO nanoparticles in the films, while the optical band gap was found to decrease.
References
- Indolia A, Gaur M. Optical properties of solution grown PVDF-ZnO nanocomposite thin films. J Polym Res. 2013; 20(1): 43. doi: 10.1007/s10965-012-0043-y
- Shanshool HM, Yahaya M, Yunus W, Abdullah IY. Measurements of Nonlinear Optical Properties of PVDF/ZnO Using Z-Scan Technique. Braz J Phys. 2015; 45(5): 538-544. doi: 10.1007/s13538-015-0345-8
- Salimi A, Yousefi AA. Analysis Method - FTIR studies of β-phase crystal formation in stretched PVDF films. Polym Test. 2003; 22(6): 699-704. doi: 10.1016/S0142-9418(03)00003-5
- Savitha Unnikrishnan K, Sunil Jose T, Dinoop lal S, Arun KJ. Glass fiber reinforced bismaleimide/epoxy BaTiO3 nano composites for high voltage applications. Polym Test. 2020; 87: 106505. doi: 10.1016/j.polymertesting.2020.106505
- Mathur SC, Scheinbeim JI, Newman BA. Piezoelectric properties and ferroelectric hysteresis effects in uniaxially stretched nylon-11 films. J Appl Phy. 1984; 56(9): 2419. doi: 10.1063/1.334294
- Batra A, Showe A, Sampson J, Kassu A, Curley M, Arun K. Fabrication and Optical Characterization of Polyvinylidene Fluoride/Neodymium Oxide Nanocomposite Films. OALib Journal. 2019; 6(12): 1-11. doi: 10.4236/oalib.1105979.
- Alomari A, Batra A, Arun KJ. Optical and electronic characterization of P(VDF-TrFE)/La2O3 nanocomposite films. Optik. 2016; 127(22): 10335-10342. doi: 10.1016/j.ijleo.2016.08.050
- Chanmal C, Jog J. Dielectric relaxations in PVDF/BaTiO3 nanocomposites. Express Polym Lett. 2008; 2(4): 294-301. doi: 10.3144/expresspolymlett.2008.35
- Devi PI, Ramachandran K. Dielectric studies on hybridised PVDF–ZnO nanocomposites. J Exp Nanosci. 2011; 6 (3): 281.
- Bohara BB, Batra AK, Arun KJ, Aggarwal MD, Farley C. Fabrication and Characterization of Polyvinylidene Fluoride Trifluoroethylene/Samarium Oxide (Sm2O3) Nanocomposite Films. Adv Sci Eng Med. 2017; 9(1): 1. doi: 10.1166/asem.2017.1962
- Arun KJ, Joseph Francis PJ, Joseph R. Mechanical properties of nr latexnano silica composites. Optoelectron Adv Mater Rapid Commun. 2010; 4(10): 1520-1525.

