Research Article
Surface Morphology Analysis of Microcellular Foam Injection Parts Molded using the PP/N2 System
Institute of Forming Technology & Equipment, Shanghai Jiao Tong University, Shanghai, China
*Corresponding author: Guanghong HU, Associate Professor, Institute of Forming Technology & Equipment, Shanghai Jiao Tong University, Shanghai, China, E-mail: hguangh@sjtu.edu.cn
Received: September 22, 2016 Accepted: September 29, 2016 Published: October 5, 2016
Citation: Hu G, Hu YB. Surface Morphology Analysis of Microcellular Foam Injection Parts Molded using the PP/N2 System. Madridge J Nanotechnol Nanosci. 2016; 1(1): 14-21. doi: 10.18689/mjnn-1000106
Copyright: © 2016 The Author(s). This work is licensed under a Creative Commons Attribution 4.0 International License, which permits unrestricted use, distribution, and reproduction in any medium, provided the original work is properly cited.
Abstract
According to the relationship model between the surface roughness and surface cell size of microcellular foam injection molding parts, this study investigated the effects of five process parameters (melt temperature, injection velocity, injection pressure, pre injection location, and supercritical fluid injection time) on surface roughness through the Taguchi design-of-experiment method. Variance analysis results revealed the significance and influence of each parameter on surface roughness. Comparing SEM micrographs under different injection conditions indicated that larger broken surface cells cause swirl marks and smaller oriented cells form sliver streaks. Thus, a smaller surface cell size indicates higher surface quality. Furthermore, cell deformation was examined and cells were controlled according to the SEM surface scanning results. Finally, the optimal process parameter combination and surface quality improvement method were proven through a confirmation injection test.
Keywords: Surface Roughness; Cell deformation; Cell size; Process parameters.
Introduction
The microcellular foam molding process was first developed by Prof. Nam Suh in the 1980s to conserve material by using supercritical fluid (SCF) as a blowing agent without substantially compromising mechanical properties [1-2]. The microcellular foam injection molding process can be divided into four stages: (a) melt polymer-SCF single phase mixer generation,(b) bubble nucleation,(c) bubble growth,(d) product typing. Compared with the traditional foam molding process, the microcellular foam molding process is advantageous for part physical properties and at the processing stage. Microcellular foam injection parts contain bubble-population densities of 109–1012 cells/cm3 and bubble sizes of 1–100μm, and possess excellent mechanical properties such as dimension stability and thermal stability, as well as other dielectric properties. The microcellular foam injection molding process also has many advantages during processing, which involves decreasing injection and packing pressure and reducing the process cycle time [3-4]. Because of the valuable economic prospects of conserving energy and resources, the microcellular foam injection molding process has become crucial in lightweight industrial applications. It is widely used in the automobile, electronics, and home appliance industries.
However, lowered surface quality of microcellular foam injection parts has been a major barrier, limiting the industrial applications of such parts, especially in exterior parts. Such surface quality defects include swirl marks, silver streaks, surface blistering, and post blow defects. Furthermore, traditional surface finishing processes, such as grinding, polishing, and lapping, cannot eliminate these defects.
Surface defects
Postblow defects
Postblow defects continually appear at part hotspots. In general, postblow defects are caused by two factors. First, the mold cooling system is not sufficient at the hotspots; and second, excessive gas enters certain bubbles because of the high SCF concentration, forming large bubbles. When the pressure inside the bubbles surpasses the tolerance of the solidified polymer, postblow defects occur. In general, methods for enhancing cooling at the hotspots and adjusting SCF concentration are effective for eliminating postblow defects [5].
Surface blistering
When numerous minuscule bubbles converge at athin part-wall, a thin polymer layer is produced, separated from the part body. This phenomenon is called surface blistering. Surface blistering most likely appears in parts that are injected with crystalline polymer, but without a filler such as POM. Surface blistering can also be eliminated by adjusting the microcellular foam injection process parameters and improving the mold design [6].
Swirl marks
Grooves on the part surface are caused by trapped gas on the mold surface when the melt polymer-SCF mixer begins to solidify. The groove surface area shows positive correlation. The groove shape is slender along the flow direction. The groove aspect ratio indicates the shear strength caused by the polymer-SCF mixer filling behavior in the mold cavity. Swirl marks are grooves whose shapes are curled (Figure 1a). Yoon proposed that the glass transition temperature (for the amorphous polymer) and melt temperature (for the crystalline polymer) are critical factors contributing to swirl mark formation [7]. Zhang indicated that swirl marks always appear near the gate [8]. While the polymer-SCF mixer is injected into the mold cavity, process parameters at different cavity areas varied. Near the gate, the temperature is generally higher, the viscosity of the polymer-SCF mixer is lower, and the melt strength is lower. Therefore, the gas near the gate easily diffuses to the cavity surface, and the bubbles near the surface break up easily [9].
Silver streak
Silver streaks are defects that display silver gloss under sunlight (Figure 1b). Silver streaks on a microcellular foam injection part have two appearances. One is called silver thread because its boundary resembles a thread. This defect is caused by broken bubbles at the surface. The other is called silver strip because it resembles a strip that parallels the flow direction. They differ according to whether broken bubbles occur at the surface. Michaeli and Cramer suggested that silver streaks were flow marks of the polymer-SCF mixer on the mold cavity surface. The shear deformation of the bubbles occurred near the surface. The depth of silver threads and part surface roughness differed because of differing bubble sizes. Compared with silver trips, silver threads caused greater surface roughness [10].
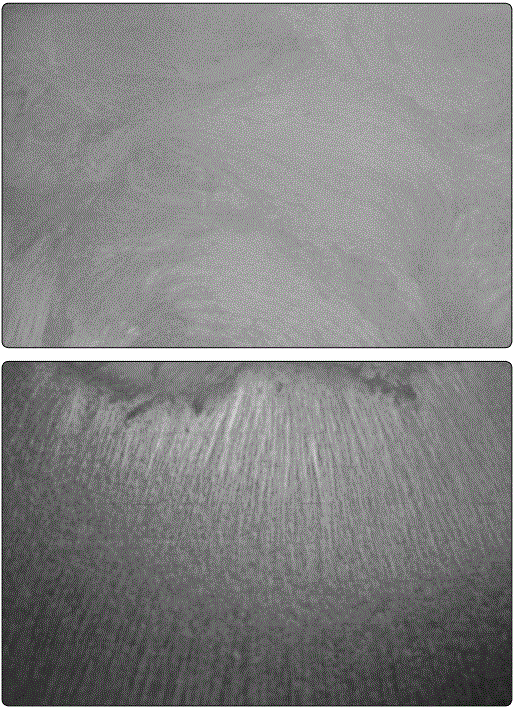
Both postblow defects and surface blistering are considerable size defects caused by poor part structure, injection mold design, or improper injection process parameter settings. However, such defects can be mitigated through design optimization. Swirl marks and silver streaks are more difficult to remove than other defects. These two defects are the main obstacles affecting industrial applications. To improve part surface quality, this study focused on analyzing microcellular foam injection part surface morphology, specifically concerning swirl marks and silver streaks. Both swirl marks and silver streaks are closely associated with bubble growth and breakdown on the surface. Thus, in this study, surface roughness was introduced to characterize the bubble growth and breakdown on part surfaces. Furthermore, cell deformation was examined and cells were controlled according to the SEM surface scanning results. Surface quality improvement suggestions are proposed here in.
Surface roughness model
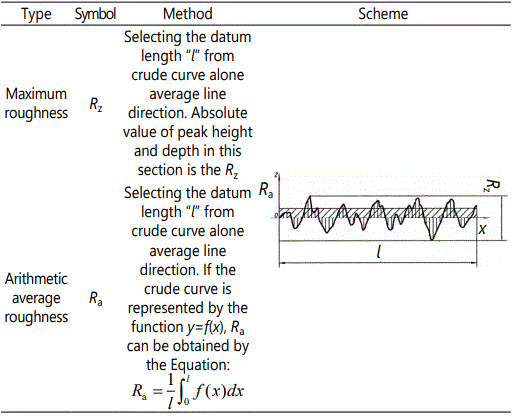
According to the hypothesis that maximum surface roughness is formed when surface bubbles expand to their maximum size and burst, a surface roughness model can be used to establish the relationship between the final bubble size and surface roughness [11]. Two common simplified roughness mathematical models are introduced in Table 1 [12].
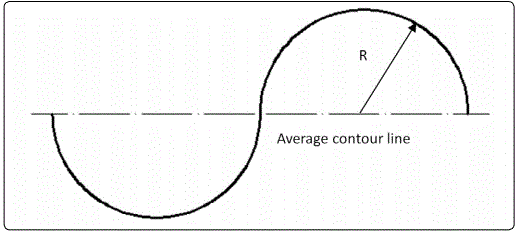
The height difference between the highest surface peak and the lowest valley was due to a complete breakdown caused by an entire bubble breakdown. The connection angle is generally considered to become passive after the bubbles burst. The crest portion and trough portion eventually form the two halves of a cell. Figure 2 shows the sketch map of surface roughness.
The maximum roughness Rz and the arithmetic average roughness Ra can be calculated as follows:


where R is the bubble radius near the melt surface. In this study, the maximum roughness Rz and arithmetic average roughness Ra were both used to analyze surface roughness.
Furthermore, this study employs the orthogonal experimental method to arrange the experimental process parameters. Each group of experimental specimen surface roughness is measured. The effects of process parameters on the microcellular foam injection molding part surface roughness were analyzed. The optimization of surface quality was performed using a Taguchi design-of-experiment (DOE) with the signal-to-noise ratio (SNR) and variance analysis. In addition, according to the optimization results, comparison experiments were performed. According to the surface morphology analysis (through SEM) of the comparative trialsʼ specimens, a method for improving the surface quality is proposed.
Experimental
Materials
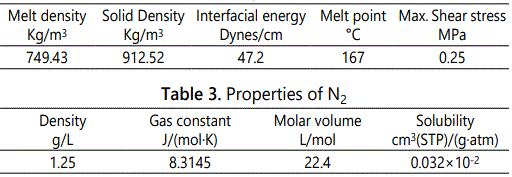
The experimental parts were molded using a PP/N2 foaming system. PP (PP-R200, Kingfa Polymer) is widely used in the auto industry. Prior to processing, PP was dried for 4h at 70°C because of wet weather conditions. N2 (purity: 99.9%, w/w) was purchased from Wuhan Gas Inc. (Wuhan, China). The properties of PP and N2 are listed in Tables 2 and 3.
Experimental model and injection machine
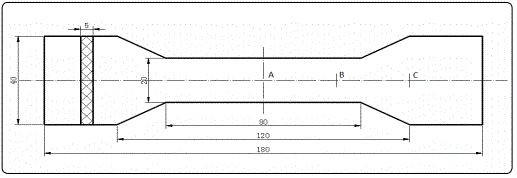
A dumbbell model with 180mm × 40mm × 5mm dimensions was used as the experimental sample. To analyze surface roughness, three measurement points (A, B, C) were applied. Figure 3 shows the experimental model and the position details of the three measurement points.
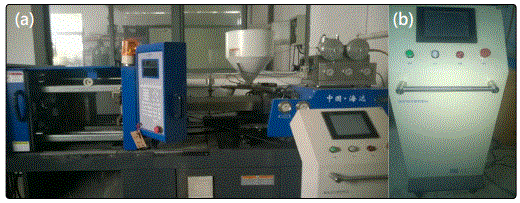
The injection machine used was an HDX50 (Haida Machinery) with a 30 mm screw diameter and an 18screw aspect ratio. The maximum screw speed is 250rpm and the maximum clamp force is 500KN. The maximum plasticity capacity is 9.6g/s and the maximum injection volume is 75cm3. The microcellular foam system was manufactured by Beijing Zhongtuo Co. The SCF output was controlled according to time; the minimum time was 1s. The injection machine and microcellular foam control system are shown in Figure 4.
Experimental design
A full factorial DOE was conducted to arrange the experiments. The five parameters studied in the DOE were the melt temperature, injection velocity, injection pressure, preinjection location, and SCF injection time. All process parameters varied according to four levels. However, the preconditions of each parameter level value setting require the cavity to be filled. The combination of the control parameters provides a total of 16 experiments, as shown in Table 4.

Surface roughness measurement
In this study, a mobile roughness measuring instrument (MarSurf M300C, Mahr) was employed to measure specimen surface roughness. The Marsurf M 300C has favorable measurement accuracy (0.001μm) and a measurement error rate of approximately 0.5%. The sampling length was set at 0.8mm and the evaluation length at 4mm. Moreover, to guarantee measurement accuracy, five specimens of each experimental parameter combination were measured; the average measurement value is addressed in the results and discussion section.
Surface characterization by using SEM
SEM (FEI XL30 FEG, Philips) was employed to further characterize part surface morphology and quality. Before scanning, each specimen was gilded. The specimen section near the surface and Point A on the surface morphology were scanned, as described in the results and discussion section.
Results and Discussion
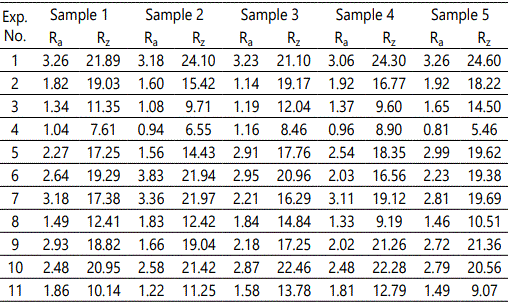
According to the L16 (45) orthogonal table and process parameter settings shown in Table 4, 16 group experiments were conducted. The MarSurf M 300C was used to measure the surface roughness at Point A of each specimen. To minimize the test error, every group comprised five specimens that were tested and recorded. Further more, both Ra and Rz were measured to ensure the accuracy of the subsequent discussion and conclusion. The collected data are listed in Table 5.

Effects of process parameters on surface roughness
The SNR was used to determine the performance of the measurements from the Taguchi method. This method reduces various noise factors such as environmental and equipment conditions. To determine the part quality and optimize the process parameters, the Taguchi method contains several SNR functions according to the type of characteristic present. The most frequently used functions are smaller-the-better, nominal-the-better, and larger-the-better. The smaller-the-better function indicates that the desired response is the minimum. The SNR can be calculated using Equation 3 [13].

where n and yi are the number of tests in a trial and the experimental measurement value, respectively. The SNR unit is the decibel (DB). In this study, two surface morphological characterizations were considered as the responses (surface roughnesses Ra and Rz).
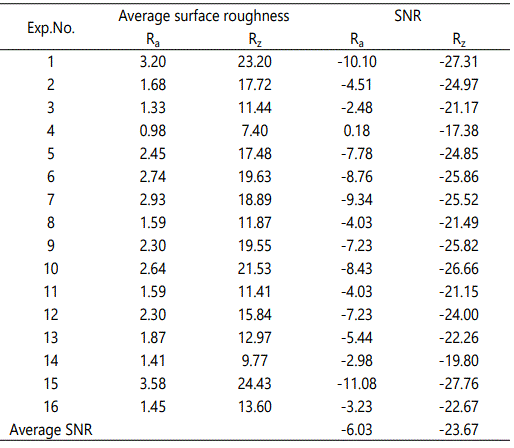
Furthermore, the only positive surface quality criterion in this study is that the lower surface roughness value is higher. This criterion was applied to understand more clearly the effects of process parameters on surface quality. A series of experiments were performed to identify this relationship. The smaller-the-better quality characteristics were considered to determine the significance of process parameters and to minimize Ra and Rz through standard deviation. Additionally, five experimental observations were conducted for each trial (n=5). The average and SNR values for each experimental trial are reported in Table 6. The effect of each process parameter on surface roughness is discussed as follows.
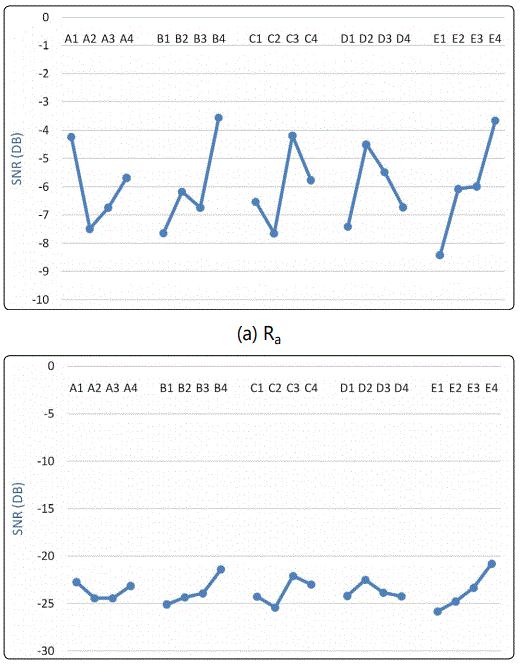
The influence degree that each process parameter has on surface roughness (Ra and Rz) was sorted according to the range analysis. The range analysis values are listed in Table 7. Thus, the influential tendency diagrams were constructed (Figure5). According to Table 7 and Figure 5, the effect trends of process parameters on surface roughnesses Ra and Rz are nearly identical. Furthermore, Figure 5 indicates that the sequence of parameters for surface roughness from large to small is the SCF injection time, injection velocity, injection pressure, preinjection location, and melt temperature.
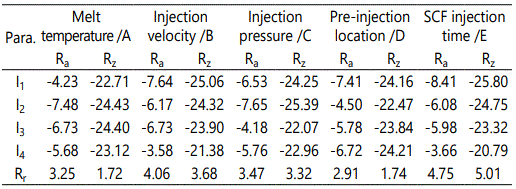
Where Ii is the mean value of the SNR sum of i level, and Rr is the range value.
As mentioned, the morphology of SCF on part surface was the most critical factor contributing to the poor injection part surface quality. In general, cell growth and breakdown is the cause of high surface roughness. To analyze the effects of process parameters on surface quality, the cell radius on the part surface was calculated according to the surface roughness value as measured using Equation 1 and 2. The results are shown in Figure 6 According to Figure 6, the relationship models between surface roughness and cell radius are accurate. The effect results of process parameters on the cell size can be applied to determine the relationship between process conditions and surface roughness.
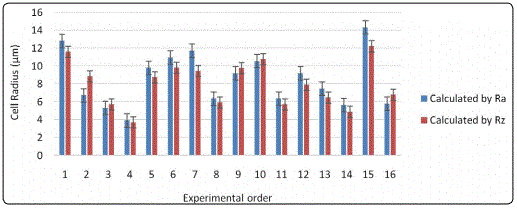
Increasing the SCF injection time engenders an increase in the amount of SCF fraction in the melt polymer–SCF mixer. Thus, more nucleation sites occur and the cell number increases in the parts. The higher number of cells contributes to the more rapid consumption of the available gas, which results in smaller cells. Further more, the crystallization inside the bulk polymer increased because of the biaxial deformations resulting from cell growth when SCF exited the melt mixer. Because crystallization is endothermic, local temperatures decrease faster, enabling the foam to stabilize more rapidly; that is, to reach a point of sufficient solidification to prevent further cell growth [14]. This effect results in smaller cells. However, excessive SCF causes cell coalescence, which generates a lower number of nucleation sites and larger cells. According to Figure 6 and Equations 1 and 2, a lower cell size contributes to lower surface roughness, and vice versa. Furthermore, Figure 5 and Table 7 indicate that the injection velocity and injection pressure are the significant factors influencing surface roughness (cell size). A higher injection velocity reduces the possibility of premature cell formation in the runner system [15]. Furthermore, because of the higher injection pressure, cell formation starts inside the mold cavity, leading to smaller cells. Additionally, higher injection pressure increases the elasticity of the polymer through melt compressibility so that the cell requires more energy to grow, and therefore, the cell size decreases. However, the melt temperature affects the melt viscosity, surface tension, and SCF concentration that influences the final size of a cell [16] (16). As shown in Figure 5, the cell size increases when the melt temperature increases because of greater SCF diffusion into the cells. Evidently, a higher melt temperature also reduces the melt strength and surface tension of the melt mixer. Therefore, the cell splits into smaller cells, causing the final size of the cell to become smaller. This previously mentioned relationship between the surface cell size and surface roughness is indicated in Figure 5, which displays the reasonable effects of the process parameters on surface quality.
Analysis of variance
Analysis variance (ANOVA) was used to evaluate the relative importance of each factor to determine the optimal process parameter combination [17]. Additionally, by using ANOVA, the contribution significance of each process parameter on the surface roughnesses (Ra and Rz) can be determined. Table 8 shows the ANOVA results.

Where S is the sum of square, F-R is the F ratio and P is the contribution of factor.
Table 8 reports the contribution of each process parameter to the surface roughnesses (Ra and Rz) for evaluating the importance of each process parameter on the response. The results indicated that the SCF injection time has the most significant impact on the objective function values. The effects of injection velocity and injection pressure are also crucial. However, the contributions of the melt temperature and preinjection location are lower than those of the other parameters.
According to Figure 5 and Table 8, the optimal process parameter combination is a melt temperature of 210°C, an injection velocity of 12.5g/s, an injection pressure of 80MPa, a preinjection location of 65mm, and an SCF injection time of 2.5s. Because the optimal combination is not in L16 experiments, the confirmation injection was performed and the surface roughness at Point A was also analyzed. The scanning result indicated a roughness of 6.78μm. The SEM micrograph near Point A on the specimen injected under optimal conditions is shown in Figure 7d. The SEM photo also illustrates that the cell size results were consistent with the surface roughness test values. For determining the effects of process parameters on surface quality, the SEM micrographs of the No.15 (the poorest roughness; Table 6), No.4 (the greatest), and No.11 (moderate) specimens are compared in Figure 7.
Surface quality improvement methods
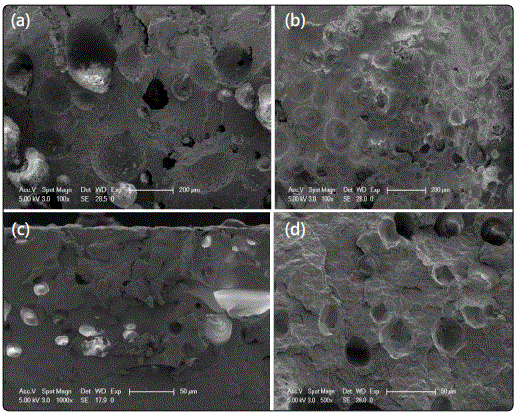
Evidently, the injection part surface quality is determined by not only surface roughness but also surface morphology. Figure 8a shows the SEM micrograph of the No.1 experimental specimen surface at Point A. It indicates that such surface morphology is formed because of surface cell deformation. In addition, when the surface cell size is smaller, cell deformation characterization is lower, and surface roughness is lower. Furthermore, lower cell deformation and lower surface roughness indicates surface quality evaluation. Figure 8b,c,d show the SEM micrographs of the Nos.2–4 experimental specimen surfaces at Point A. The photos are consistent with this conclusion.
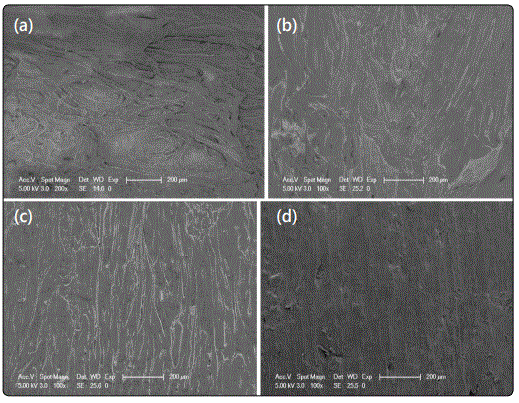
From a microcosmic viewpoint, Figure 8a shows a swirl mark view and Figure 8b, c show silver streaks. However, Figure 8d shows higher surface quality. Thus, the cell size ostensibly determines the surface defect type. Large surface cell deformation causes swirl marks and small cells cause sliver streaks.
Therefore, cell deformation is the additional factor that influences surface quality. From a macrocosmic viewpoint, a silver streak is the surface cell deformation coinciding with the polymer melt filling direction. Thus, cell deformation force is evidently shear stress between the mold cavity and part surface, because shear stress and the filling direction are equivalent to tensile force. In general, with an increase in shear stress, the magnitude of cell deformation and degree of breakdown should increase and the surface quality should decrease. However, when the shear stress becomes sufficiently large, which should be less than the polymer maximum shear stress criterion, the cell can split into smaller cells.
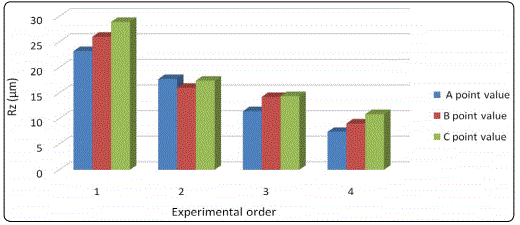
Moreover, because of the difference in position, the surface cell nucleation and growth conditions differ within the same cavity. In addition to Points A, B, and C (Figure 4), experimental specimensNos.1–4 were also tested as research points. The surface roughness values at Points B and C are listed in Tables 9 and 10.


According to Tables 6, 9, and 10, the surface roughness values for a single specimen at different points are compared (Figure 9). Figure 9 indicates that the surface roughness (except for the No.2 experimental result) increases with the position distance from the gate location. This is because when the flow path becomes longer, cells have more time to grow before they reach the part surface or are solidified. Thus, the cells become larger. The larger cells were cracked by the shear stress, causing high surface roughness.
The first step toward improving surface quality involves controlling the surface cell size. According to cell growth theory, cell radius R can be controlled using Equation 4 [18]:

Where η is the melt viscosity, Pg is the gas pressure in the microcell, σ is the surface tension at the interface of the melt and the gas, and P is the pressure of the melt mixer at the outer boundary of the cell. Here, P can be determined by the mold cavity inner pressure. Thus, when the mold cavity inner pressure increases, the cell size R can be decreased. Second, reducing the cell deformation is also crucial, meaning that the shear stress between the mold cavity and part surface should be controlled and decreased. In general, applying a higher mold temperature is effective for reducing shear stress.
Conclusion
According to the relationship model between surface roughness and cell size, this study examined the effects of microcellular foam injection molding process parameters on part surface morphology. The melt temperature, injection velocity, injection pressure, preinjection location, and SCF injection time varied according to the Taguchi DOE method of evaluating surface quality. According to ANOVA, the SCF injection time was the most critical factor influencing surface roughness. Injection velocity and injection pressure also had significant effects. However, the melt temperature and preinjection location had weaker effects on surface roughness. Furthermore, the SNR results were applied to determine the optimal process parameter combination. Furthermore, the confirmation injection parts configured to optimal conditions had the highest surface roughness.
After the SEM micrographs of different experimental conditions were compared, the accuracy of the relationship model between the surface roughness and cell size was further verified. The larger broken surface cells caused swirl marks, and the smaller oriented cells formed sliver streaks. Thus, for improving surface roughness, smaller surface cells are more effective. This study also investigated the effect of surface cell deformation on surface quality through SEM analysis of different specimen surface morphologies. Cell deformation was controlled by the shear stress between the mold cavity and the part surface.
The surface roughness at different cavity locations was then tested. Surface roughness increased with the position distance from the gate location. Finally, increasing the cavity pressure was determined to be a useful method for reducing the entire part surface cell size and improving surface quality. Additionally, reducing shear stress could effectively control surface cell deformation.
Acknowledgements
The authors would like to thank Shanghai Nature Foundation, China (No.13ZR1420500) for financial support.
Conflicts of Interest: The authors declare no conflicts of interest with this submission.
References
- Shiachung C, Haimei L, Shyhshin H, et al. Passive mold temperature control by a hybrid filming-microcellular injection molding processing. International Communications in Heat and Mass Transfer. 2008; 35(7): 822–827. doi: 10.1016/j.icheatmasstransfer.2008.03.013
- Yue W, Guanghong Hu. Research progress of improving surface quality of microcellular foam injection parts. Applied Mechanics and Materials. 2011; 66-68: 2010-2016. doi: 10.4028/www.scientific.net/AMM.66-68.2010
- Erzurumlu T, Oktem H. Comparison of response surface model with neural network in determining the surface quality of moulded parts. Materials & Design. 2007; 28(2): 459-465. doi: 10.1016/j.matdes.2005.09.004
- Huili C, Reander C, ShiaChung C. Using thermally insulated polymer film for mold temperature control to improve surface quality of microcellular injection molded parts. International communications in heat and mass transfer. 2008; 35(8): 991-994. doi: 10.1016/j.icheatmasstransfer.2008.04.017
- Goel SK, Beckman EJ. Generation of microcellular polymeric foams using supercritical carbon dioxide. I: Effect of pressure and temperature on nucleation. Polymer engineering and science. 1994; 34(14): 1137-1147. doi: 10.1002/pen.760341407
- Barzegari MR, Rodrigue D. The effect of injection molding conditions on the morphology of polymer structural foams. Polymer engineering and science. 2009; 49(5): 949-959. doi: 10.1002/pen.21283
- Amon M, Denson CD. A study of the dynamics of foam growth: analysis of the growth of closely spaced spherical bubbles. Polymer engineering and science. 1984; 24(3): 1026-1034. doi: 10.1002/pen.760241306

