Research Article
Serum Uric Acid to Creatinine Ratio as a Marker of Estimated Glomerular Filtration Rate in Type 2 Diabetes Patients
1Clinical Laboratory Unit, Ladyao Hospital, Nakhonsawan, Thailand
2Chronic Diseases Research Unit, Department of Medical Technology, Faculty of Allied Health Sciences, Naresuan University, Phitsanulok 65000, Thailand
*Corresponding author: Surapon Tangvarasittichai, Associate Professor, Department of Medical Technology, Faculty of Allied Health Sciences, Naresuan University, Phitsanulok, 65000, Thailand, Tel: +66055966276, Fax: +66-0-5596-6300, E-mail: surapon14t@yahoo.com
Received: April 3, 2018 Accepted: April 20, 2018 Published: April 26, 2018
Citation: Sengsuk J, Tangvarasittichai O, Tangvarasittichai S. Serum Uric Acid to Creatinine Ratio as a Marker of Estimated Glomerular Filtration Rate in Type 2 Diabetes Patients. Madridge J Diabetes. 2018; 2(1): 36-41. doi: 10.18689/mjd-1000107
Copyright: © 2018 The Author(s). This work is licensed under a Creative Commons Attribution 4.0 International License, which permits unrestricted use, distribution, and reproduction in any medium, provided the original work is properly cited.
Abstract
Chronic kidney disease (CKD) is a global health care problem; Serum creatinine (SCr), Serum uric acid (SUA) levels has shown to be the markers of renal disease progression. We aim to test renal function-normalized serum uric acid (SUA/SCr ratio and SUA*GFR/100; corresponding with their eGFR equation) as biomarkers of estimated glomerular filtration rate (eGFR) and CKD identification in type 2 diabetes mellitus (T2DM) patients. A total of 446 T2DM patients were included. Three eGFR equations were used as: Cockroft-Gault (eGFR1), the modification of diet in renal disease (MDRD) (eGFR2) and CKD-epidemiology collaboration (eGFR3) equation. Kruskal-Wallis test and Mann-Whitney U-test were used to compare the differences all groups and intergroup. ROC curve was used to indicate better marker, discrimination, and cut-off values generation. SUA*eGFR/100 and eGFR were significantly different in eGFR3 and caused the different values of SUA*eGFR/100 in total T2DM patients. The number of CKD patients (eGFR 30-59.9 ml/min/1.73 m2 ) was different according to their eGFR equations and found significantly different in eGFR of each group and SCr, SUA, SUA/SCr ratio, and SUA*eGFR/100 in eGFR3 group. Bivariate correlation of SUA/SCr ratio, SUA*GFR/100 were significantly correlated with eGFR1, eGFR2, eGFR3 and the other variables both in total and in CKD group. SUA/SCr ratio, SUA*eGFR/100 with each eGFR equations cut-off values for CKD identification were generated.
Conclusion: SUA/SCr ratio can be used as a biomarker of GFR estimation and CKD identification, likely with eGFR but easier calculation. SUA/SCr ratio cut-off values were provided corresponding with their eGFR equations for selection.
Keywords: Serum creatinine; Serum uric acid; Estimated glomerular filtration rate; Cockroft-Gault; The modification of diet in renal disease; CKD-epidemiology collaboration.
Introduction
Kidney dysfunction and albuminuria are determinants as independent risk factors for chronic kidney disease (CKD) and cardiovascular disease (CVD) [1, 2]. Chronic kidney disease is a global health care problem; hyperglycemia and hypertension are the modifiable risk factors to control these factors are important for CKD prevention [3]. Patients with CKD may have one or more of these following, pathologic abnormalities, markers of kidney injury or damage (imaging, serum or urine sediment abnormalities and albuminuria), or GFR <60 mL per minute per 1.73 m2 for at least three months [4]. Diabetes mellitus is the major and leading cause of CKD globally [5].
Serum creatinine (SCr), blood urea nitrogen (BUN) and serum uric acid (SUA) levels and urine analysis were commonly used for kidney function estimation [6]. However more evidences are demonstrated these biomarkers are not reach the optimal detection of the early stages of kidney disease [7-10]. The Kidney Disease Improving Global Outcomes recommends that glomerular filtration rate (GFR) is a determinant for diagnosis, classification and staging CKD [11]. GFR is the volume of body fluid filtered through the glomerular capillaries of the Bowman's capsule per unit time [12, 13]. GFR was usually used in clinical practice for drug dosing, diagnosis, prognosis and management in addition with public health and research works [14-16].
Serum creatinine (SCr) is a common marker for detecting the GFR changing and CKD stage, elevated SCr as a marker of renal disease and decreased renal function [17]. Similarly, elevated SUA level is also commonly observed in CKD patients. It is a simple biochemical marker for impaired or pathogenic role of kidney function [18, 19]. An elevated SUA was also associated with impaired renal function in type 2 diabetes mellitus (T2DM) patients [20], and used as predictor of development and progression of CKD in T2DM patients. [20, 21] In general physiological, renal clearance of SUA is often impaired during kidney injury or dysfunction, renal function is the major confounder in studies of the association between SUA with CKD progression [22].
The renal function-normalized SUA (SUA/SCr ratio and SUA*GFR/100) is studied before as the biomarker of the chronic obstructive pulmonary disease, metabolic syndrome and higher in the population with high prevalence of metabolic syndrome and T2DM [23, 24-26]. Because of the many formulas of the eGFR including sex, weight, race and many mathematic numbers were used in the clinical practice and provided the different results. But the SUA/SCr ratio is easier calculation by using the general biochemical markers no any additions. In the present study, we aim to demonstrate the renal function-normalized SUA (SUA/SCr ratio and SUA*GFR/100) [23] as the biomarkers for eGFR and CKD detection in T2DM patients.
Materials and Methods
Subjects
A total of 446 T2DM patients (overt diabetes more than 5
years) were randomized from the Diabetes Care Clinic of Ladyao
Hospital during January 2015 to December 2016. All T2DM
patients were receiving regular treatment with glycemic lowering,
lipid lowering, and anti-hypertensive medication. The exclusion
criteria were sustained heart failure, peripheral vascular disease,
recent myocardial infarction, unstable angina, stroke, acute or
chronic infection, cancer, hepatic disease, acute illness in the year
of recruitment. All participants gave written informed consent.
Our study protocol was approved by the Ethic committees of
Naresuan University.
Physical and Biochemical Examination
All T2DM underwent anthropometry, blood pressure
measurement and physical examination. Body mass index (BMI)
was calculated and waist circumference (WC) was measured at
the midpoint between the rib cage and the top of lateral border
of iliac crest at minimum respiration. BP was measured after the
participants had been seated and rested for 5 minutes, as the
mean value of at least two measurements for these participants
on the same day with calibrated desktop sphygmomanometers.
Venous blood samples were collected from all participants
without stasis after 8-12 hour fast in a seated position. Blood
specimens were processed and assayed in the clinical laboratory
of Ladyao Hospital, Nakhonsawan, Thailand. Plasma glucose
(Glu), blood urea nitrogen (BUN), serum uric acid (SUA), total
cholesterol (TC), triglyceride (TG), high density lipoprotein-cholesterol (HDL-C) were measured by enzymatic method.
Serum creatinine (SCr) and urine creatinine (UCr) concentrations
were determined based on the Jaffe reaction. Low density
lipoprotein-cholesterol (LDL-C) concentrations were calculated
with Friedewald's formula in specimens with TG levels <400 mg/
dl. Urine samples were collected in polyethylene bottles after
physical examination and blood taken for N-acetyl-β-Dglucosaminidase (NAG) and UCr determination. SUA/SCr ratio
and SUA*GFR/100 were calculated according to their formula.
Hemoglobin A1C Measurement
HbA1c levels were assayed by using turbidimetric
inhibition immunoassay (TINIA) on hemolyzed whole blood
(standardized according to the International Federation of
Clinical Chemistry) by use of a Hitachi 912 auto-analyzer
(Roche Diagnostic, Switzerland)
High sensitivity-C-reactive protein (hs-CRP) Measurement
The hs-CRP levels were assayed by using latex-enhanced
immunoneplelometric method on the Hitachi 912 auto-analyzer (Roche Diagnostic, Switzerland) that has been
standardized against the World Health Organization
reference.
Urinary NAG (UNAG) Measurement
The assay is based on NAG in urine reacting with the
substrate of p-nitrophenyl-N-acetyl- β -D-glucosaminide in
sodium citrate buffer (pH 4.4) at 37 °C to liberate
p-nitrophenylate ion, then adding 2-amino-2-methyl-1-
propanol (AMP) buffer (pH 10.25) to the reaction and
measuring the color reaction with spectrophotometer at 405
nm [27] The within-run and between-run coefficient of
variation in control material were 3.14% and 4.11% (n=10).
Estimated Glomerular Filtration Rate (eGFR)
The eGFR of each method was calculated by as follow:
The Cockroft-Gault Equation (eGFR1)
The Cockroft-Gault formula which incorporates age, body
weight, and sex [28]. The formula is: eGFR1 = [(140 - age) *
weight (kg) *constant]/[serum creatinine (μmol/L)] where 1.23
and 1.04 are constants for men and women, respectively.
The Modification of Diet in Renal Disease (MDRD)
Equation (eGFR2)
The formula is: eGFR2 = 175 * (SCr) -1.154 * (age) -0.203
* 0.742 (If female) or 0.212 (If Black); SCr in mg/dl [29].
CKD-Epidemiology Collaboration Equation (eGFR3)
The formula is: eGFR3=141 * min (SCr/k, 1)α * max (SCr/k, 1) -1.209 * 0.993 (age) * 1.018 (If female) or 1.159 (If Black) [30].
Five eGFR stages according to clinical guidelines for chronic
kidney disease of The Kidney disease outcome quality
initiative advisory board were used: Stage I was normal eGFR
(≥90ml/min/1.73 m2
); Stage II was mildly eGFR (60-89 mL/min/1.73 m2
); Stage III was moderately eGFR (30-59 ml/min/1.73 m2
); Stage IV was severely eGFR (<30 ml/min/ 1.73
m2
), and Stage V was end-stage renal disease: eGFR (<15 ml/min/1.73 m2
). An eGFR lower than 60 ml/min/1.73 m2
(moderately eGFR) was defined as chronic kidney disease
(CKD) [31].
Statistical Analysis
All data are presented as median and interquartile range for non-normally distributed data, tested by using Shapiro-Wilk test. All clinical characteristics, eGFR,SUA/SCr ratio, SUA*eGFR/100; corresponding with their eGFR equations were compared and CKD of these T2DM patients were identified (eGFR 30-59 ml/min/1.73 m2 ) and compared clinical characteristics, number of patients according to each equation of eGFR calculation by using Kruskal-Wallis test, and compared the differences of intergroup by using Mann-Whitney U-test. Bivariate correlation between SUA/SCr ratio, SUA*eGFR/100, NAG, hs-CRP and with the other variables was assessed by using Spearman rank correlation test. A comparison of SUA/ SCr ratio and SUA*eGFR/100 in CKD and non-CKD group of each eGFR equation were analyzed in terms of a receiver operating characteristic (ROC) curve. A ROC curve is a plot between sensitivity (Y-axis) versus false positive (X-axis), obtained for different cutoff points. Areas under the curve (AUC) of the ROC curves and their 95 per cent confidence intervals (CI) were evaluated as a measure of diagnostic accuracy. A discriminate analysis was performed to identify a combination of these parameters that provided the best differentiation between CKD and non-CKD individuals. Greater AUC of the ROC curve indicated better markers of the study. In general, an AUC of a ROC of 0.5 suggests no discrimination, whereas a maximal AUC of a ROC of 1 suggests outstanding discrimination and also generate the cut-off values of SUA/SCr ratio and SUA*eGFR/100 according to each equation of eGFR calculation [32]. All tests were two tailed, and p-values less than 0.05 were regarded as statistically significant. All analysis was performed by SPSS version 13.0 (SPSS, Chicago, IL, USA).
Results
The comparison of all clinical characteristics, SUA/SCr ratio, SUA*eGFR/100; corresponding with their eGFR equations of 446 T2DM patients by using the Kruskal-Wallis test and MannWhitney U-test were demonstrated in Table 1.


SUA*eGFR/100 and eGFR are significantly different in eGFR3 Gr. These suggest that eGFR3 was significantly difference from the others and also caused the different values of SUA*eGFR/100 in total T2DM patients.
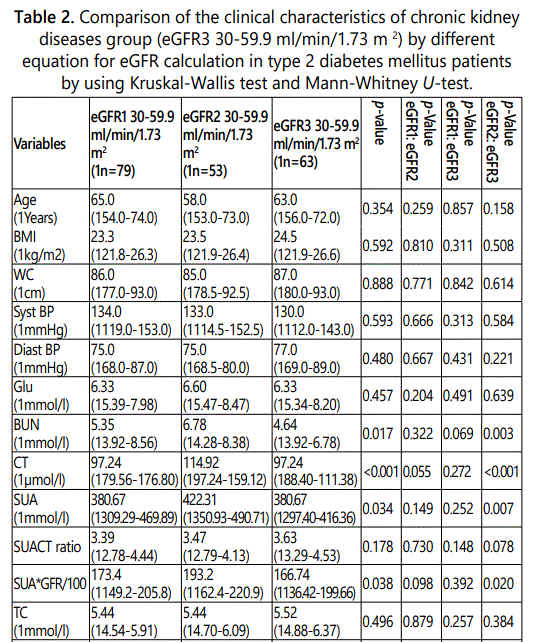
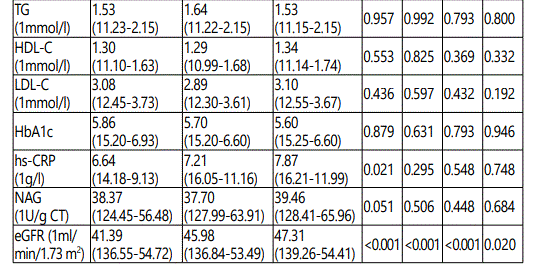
We found the difference number of subjects with eGFR 30-59.9 ml/min/1.73 m2 or CKD patients according to their eGFR equations. We also found significantly different in each eGFR group and significantly different in SCr, SUA, SUA/SCr ratio, and SUA*eGFR/100 in eGFR3 group as shown in Table 2.
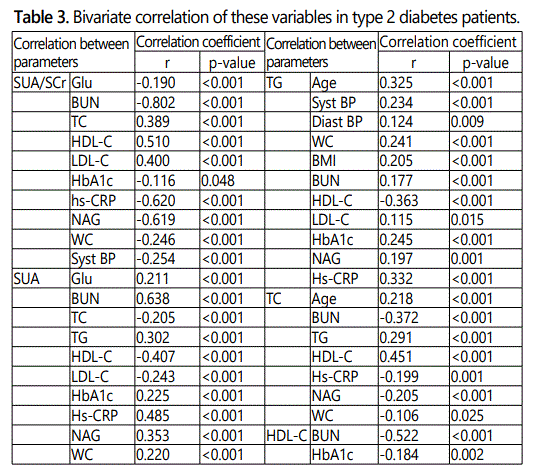
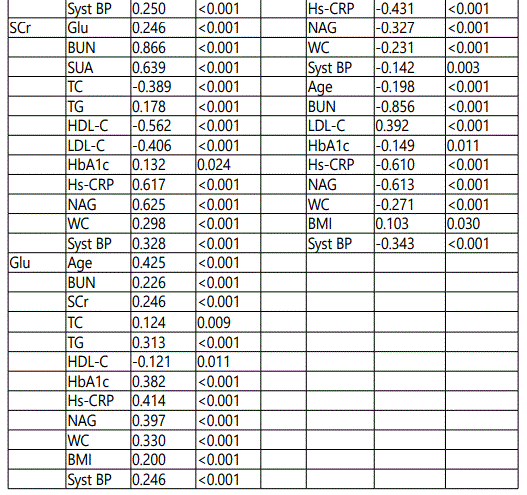
Bivariate correlation, SUA/SCr ratio was significantly correlated with the other variables and significantly correlated with eGFR1, eGFR2, eGFR3 both in total patients and CKD patients (eGFR 30-59.9 ml/min/1.73 m2) as shown in Table 3.
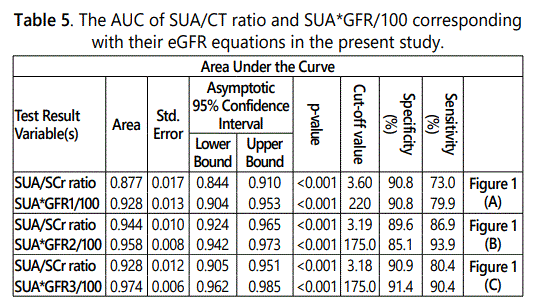
We plotted the ROC curves for SUA/SCr ratio and SUA*eGFR/100; corresponding with their eGFR equations. The results of SUA/SCr ratio and SUA*eGFR/100; corresponding with their eGFR equations ROC curve analysis showed that each marker is a significant discriminator for eGFR in CKD patients. The area under the curve (AUC) of the ROC curve was used for prediction of better markers for each eGFR in CKD patients. The AUC results were obtained with 0.877 of SUA/SCr ratio and 0.928 of SUA*eGFR1/100 (Figure 1A), 0.944 of SUA/SCr ratio and 0.958 of SUA*eGFR2/100 (Figure 1B), and 0.928 of SUA/SCr ratio and 0.974 of SUA*eGFR3/100 (Figure 1C), indicating that these models with these ratios can be used for estimating the glomerular filtration rate of T2DM patients in this study (Table 4, Figure 1).

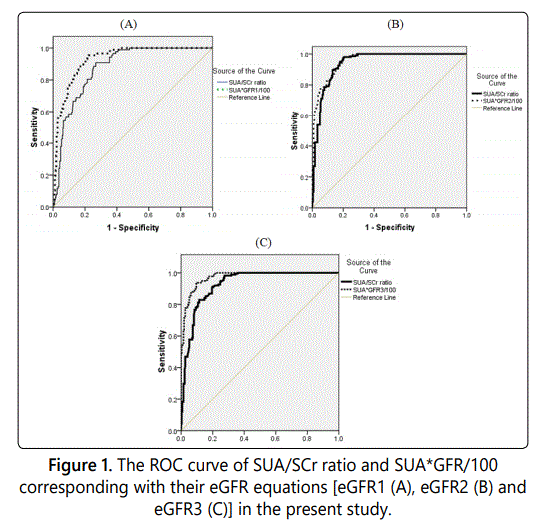
The optimal cut-off values of SUA/SCr ratio, SUA*eGFR/100; corresponding with their eGFR equations, for prediction of CKD in present study were 3.60 with sensitivity and specificity of 90.8%, and 73.0%; 220 with sensitivity and specificity of 90.8% and 79.9%, corresponding with their eGFR1 equations, 3.19 with sensitivity and specificity of 89.6%, and 86.9%; 175.0 with sensitivity and specificity of 85.1.8% and 93.9%, corresponding with their eGFR2 equations, and 3.18 with sensitivity and specificity of 90.9%, and 80.4%; 175 with sensitivity and specificity of 91.4% and 90.4%, corresponding with their eGFR3 equations, respectively (Table 5).
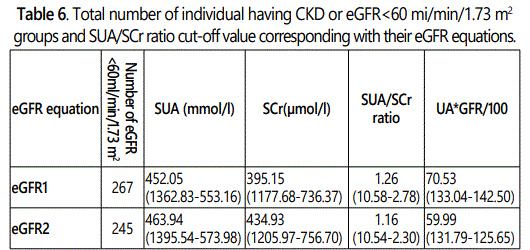
The different number of individual having lower cut-off value of SUA/SCr ratio and eGFR<60.0 ml/min/1.73 m2 (CKD) were identified by using their SUA/SCr ratio values and their eGFR equation as shown in the Table 6.

Discussion
Estimating GFR was very important and usually used in clinical practice for drug dosing, diagnosis, prognosis and management in addition with public health and renal research works [14-16]. The most commonly used equations including Cockroft-Gault (eGFR1) [28], MDRD (eGFR2) [29, 33], CKD-EPI (eGFR3) [30] and more equations that combines creatinine and CysC [34]. The results of CKD-EPI were significantly lower estimated CKD than the MDRD equation [33]. While the MDRD equation underestimates GFR in healthy individuals resulting in false negative diagnosis of CKD in this population [35].
The present study demonstrated that MDRD equation (eGFR2) resulted in higher eGFR and gave lower in number of CKD patients, and CKD-EPI equation (eGFR3) resulted in lower eGFR and gave higher in number of CKD patients, while Cockroft-Gault equation (eGFR1) resulted in the middle of these 2 equations. Our results demonstrated the same cut-off values (<3.19 and <3.18) of SUA/SCr ratio according to eGFR2 and eGFR3 and also identified the same number of CKD patients, while the SUA/SCr ratio cut-off value = <3.60 according to eGFR1 and also identified the higher number of CKD patients.
Only SUA has been shown a predictor for the progression of renal disease caused from the association of SUA and eGFR, but not all studies [36, 37]. In impaired renal function, increasing of SUA was occurred as a consequence of CKD as a strong predictor for renal disease progression. Patients with lower eGFR were higher in SUA levels and higher risks in progression of renal disease. Then, baseline renal function-normalized SUA (SUA/SCr ratio, SUA*eGFR/100), which may reflect the net production of SUA, will be better than only SUA value as the predictor of incident CKD. The Modification of Diet in Renal Disease (MDRD) Study also failed to demonstrate SUA as the predictor for progression of chronic renal failure after a 10-year follow-up in 840 individuals with CKD [20, 38, 39]. SUA/SCr ratio is studied before as the biomarker of the chronic obstructive pulmonary disease, metabolic syndrome and higher in the population with high prevalence of metabolic syndrome and T2DM [24-27].
Conclusion
The present study demonstrated SUA/SCr ratio and SUA*eGFR/100 was significantly correlated with each eGFR equations.SUA/SCr ratio can be used as a biomarker of GFR estimation in the same as eGFR but easier calculation by using the general biochemical markers no any additions. We also provide the SUA/SCr ratio cut-off value according to eGFR equations for selection.
Acknowledgement
We sincerely thank Ladyao Hospital and all co-workers of Clinical Laboratory, Ladyao Hospital for their technical assistance and supporting. We sincerely thank Asst. Prof. Dr. Ronald A. Markwardt, Burapha University, for his reading and correcting of the manuscript.
Conflict of interest
The authors declare that they have no competing interests.
References