Research Article
Diffusion and adsorption of precursor gas in foam nickel rod substrate during CVD process for deposition of graphene
1School of Petroleum Engineering, Changzhou University, No. 88 Xingyuan Road, Changzhou city 213016, the People′s
Republic of China
2School of Mechanical and Power Engineering, Shanghai Jiaotong University, No.800 Dongchuan Road, Shanghai 200240, China
3Wuxi entry-exit inspection and quarantine bureau, No. 10 Huangxia road, Wuxi, China
*Corresponding author: Bo Tang, School of Petroleum Engineering, Changzhou University No. 88 Xingyuan Road, Changzhou city 213016, the People′s Republic of China, Tel/Fax: +86 519 83295530 Email: tangbo@cczu.edu.cn
Received: November 30, 2016 Accepted: December 27, 2016 Published: December 29, 2016
Citation: Tang B, Hu G, Huang D. Diffusion and adsorption of precursor gas in foam nickel rod substrate during CVD process for deposition of graphene. Madridge J Anal Sci Instrum. 2016; 1(1): 16-20. doi: 10.18689/mjai-1000104
Copyright: © 2016 The Author(s). This work is licensed under a Creative Commons Attribution 4.0 International License, which permits unrestricted use, distribution, and reproduction in any medium, provided the original work is properly cited.
Abstract
Preparation of graphene by chemical vapor deposition (CVD) mehtod has attracted
increasing attention due to the high quality of the resulting samples. However, the
relative research on diffusion and adsorption of precursor gas (the first two steps of
graphene growth) on the transition metal surface is still insufficiently. In this study,
three-dimensional graphene networks (3DGNs) is prepared by CVD approach with a
foam nickel rod (FNR) as the template. The diffusion of CH4 in the FNR is discussed.
Then, the adsorption of CH4 on the FNR surface is studied by the expended Langmuir
equation, and the influences from H2 on the coverage ratio of CH4 and thickness of the
resutling 3DGNs is analyzed. In order to describe the dissolution-segregation process of
carbon atoms in the FNR , a parameter named “quasi-diffusivity” is proposed to avoid
the tedious calculation. Based on this parameter, the relationship between the scale of
3DGNs and growth time can be simulated, and the relationship b etween the thickness
of samples and their growth position can be predicted.
Keywords: Chemical Vapor Deposition; Graphene; Expanded Langmuir Equation;
Quasidiffusivity.
Introduction
Since its first isolation in 2004, graphene is regarded as a star material for the dyesensitized solar cells (DSSCs) and supercapacitors fields because of its outstanding electrical and mechanical properties [1]. Recently, graphene with various morphologies including large-scale plane graphene, spherical graphene and three-dimensional graphene networks (3DGNs) have been fabricated on Cu and Ni substrates by chemical vapor deposition (CVD) method [2]. Ruoff′s group found that the deposition mechanisms of graphene on Cu and Ni surfaces are similar [3]. Besides experimental results, some theoretical mechanisms have been revealed. Zhang et al. and Meng et al. calculated the thermodynamics of graphene growth on Cu and Ni surface by first-principle calculations [4,5]. In previous reports, the attention was focused on the behavior of carbon atoms on the substrate surface. However, the diffusion and adsorption of precursor gas on the substrate surface did not arouse enough attention. In fact, these two processes are closely related to the thickness and quality of the resulting graphene. Studying on these processes is important to optimize the growth parameters and understand the growth mechanism of graphene. Recently, our group prepared high-quality 3DGNs by CVD approach with the foam nickel rod (FNR) as a template [6,7], and the 3DGNs based DSSCs and supercapacitors show high photovoltaic performance. Here, we further study the growth mechanism and kinetics of 3DGNs during the CVD process. In this study, the diffusion and adsorption properties of CH4 in the porous FNR is discussed. The influence from H2 on the adsorption of CH4 and thickness of the resulting graphene is studied, as well. In order to simplify the calculation on the kinetics of graphene growth, a parameter named “quasi-diffusivity” is proposed. Based on this parameter, the relationship between scale (thickness) of the 3DGNs and growth time (growth position) can be predicted.
Material and methods
Detailed growth process of the 3DGNs has described in previous reports [6,7]. The heat preservation time are 0s, 150s, 300s, 500s, 800s and 2400s for varied samples at 1273K . An added unit was put into the reaction chamber, and the FNR were placed in the unit during the CVD process (Fig. 1, in the real case, the FNR is put into the unit).
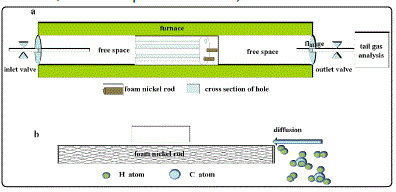
Fig. 1. (a)The schematic of the CVD system. (b) Schematic of the CH4 and hydrogen molecules diffuse into the foam nickel rod during the heat preservation process.
Results and discussion
The scale of 3DGNs on the FNR surface increases with the extended heat preservation time (see inset of Fig. 4). No 3DGNs can be found for the sample without heat preservation step, indicating that the growth of the 3DGNs depends on the diffusion of CH4 during the heat preservation process.
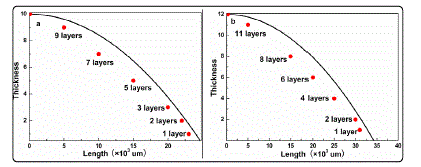
Fig. 4. (a)The schematic of the CVD system. (b) Schematic of the CH4 and hydrogen molecules diffuse into the foam nickel rod during the heat preservation process.
Diffusion of methane molecules in the FNR
The FNR possesses a three-dimensional porous morphology
with 100-150 µm in porous diameter [6,7]. The diffusion law
of gas molecules in porous medium is closely related to the
relationship between the mean free path of gas molecules and bore diameter of medium. According to the followed
formula [8], the values of mean free path of CH4, H2 and Ar at
1273K are ~380, ~660 and ~470 nm, respectively.

The R, T, NA, p and d0 are perfect gas constant, temperature, Avogadro′s constant, pressure and gas collision diameter. Due to the mean free paths of these gas molecules (atoms) are far smaller than the pore of the FNR (the ratio less than 0.01), the diffusion of them in the FNR obeys Fick′s law. For the sake of simplicity, a uniform pore structure of the FNR is assumed (~120µm in porous diameter) and the influence from its peripheral boundary is neglected. Therefore, the diffusion of CH4 molecules in the FNR takes place along the axial direction only and the following one-dimensional partial differential equation can be employed to describe the diffuse process.

Where C, u and k are concentration, convection velocity and consumption rate of CH4, respectively. The Deff is the effective diffusivity of CH4 in the FNR, which contains the pore characteristics (poriness (ε) and tortuosity (τ)) of the FNR (Deff = Dε/τ, D represents diffusion coefficient of CH4 in the free space). In the heat preservation process, the diffusion is an unsteady-state process and the convection velocity equals to zero. According to the results of tail gas analysis, the ∂C/∂t approximately equals a constant (a~13.6mgm-3s-1), thereby, the diffusion equation can be simplified into the following form in the heat preservation process:
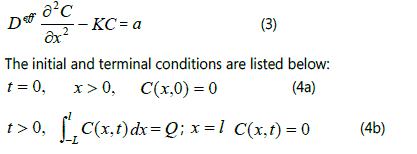
Selecting the right part of the FNR as a sample, the
calculation can be performed. L is the length of free space in
the right side of the unit, and l is the diffusion distance of CH4
in the FNR. Q is the total amount of CH4 in the free space.
According to the results of tail analysis, the proportion of CH4
in the reaction chamber is 4. 5% (the calculated value is 4.76%)
before introducing the unit. After adopting the unit, the
proportion of CH4 in the free space (right part) reduces to
4.1% (the unit separates the chamber into two parts), and the
proportion of CH4 in the free space (left part) is 4.7% by
calculation. A visible distinction of the CH4 concentration
appears in the right part and left part of the chamber,
indicating differences in the scale of the resulting 3DGNs from
the right and left parts. If the diffusion of CH4 in these two
directions is independent, the diffusivity of CH4 in the right
part of the NFR is ~10cm2s-1 at 1273K.
Adsorption of methane molecules on the FNR surface
During the CVD process, CH4 molecules adsorb on the
surface of the FNR, which is the previous step of catalytic
dehydrogenation reaction. Only the chemisorbed CH4 can
make contribution to the growth of 3DGNs, and the
dehydrogenation reactions will take place for the chemisorbed
CH4 due to the catalytic effect of the substrate. According to
Langmuir adsorption model, the covered fraction of adsorbent
surface by adsorbate at a given temperature can be expressed
as following [9]:

θ , V∞ , b and P are coverage, maximum capacity of the
adsorbent, adsorption coefficient and pressure of the
adsorbate, respectively. Subscript i represents varied
component, and n is the amount of components.
First of all, the adsorption amount of CH4 molecules on
the FNR surface at room temperature (300K) was detected. Six
different pressures (101.325, 121.59, 141.855, 162.12, 182.385
and 202.65 KPa) were adopted, and the corresponding
adsorption amounts of CH4 are listed in the Table 1. The
equation (5) can be rewritten as the following form:
Table 1 Adsorption amount of CH4 on the FNR surface under varied pressures at 300 K.

The slope and intercept are 1/V∞ and 1/b∞ when the P/V is plotted against the P, and the parameters b and V∞ can be calculated according to the curve (Fig. 2). By using identical method, the parameters b and V∞ of CH4 under varied temperatures are calculated (Table 2).
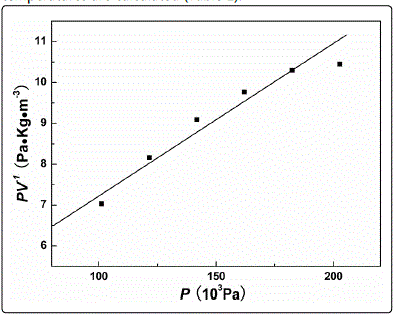
Fig. 2. PV-1 vs P curves of CH4 adsorption on the FNR.
Table 2 Adsorption parameters of CH4 on the FNR surface under varied temperatures.

Both the b and V∞ decrease with the increased temperature, indicating that high temperature leads to lower coverage of CH4 on the FNR surface. The coverage values of CH4 under varied temperatures are listed in the Table 3. In fact, the calculated values of the V∞ and θ under high temperature exceed the actual values, and two reasons may lead to this phenomenon. Firstly, the chemical adsorbed CH4 molecules start to decompose on the FNR surface under high temperature, then the resulted carbon atoms diffuse into the FNR and leave surface active sites to adsorb next CH4 molecule. Moreover, nucleation reaction of CH4 would take place in the gas phase under high temperature condition. Therefore, the V∞ value in the Table 2 includes adsorbed and consumed CH4 from above-mentioned two ways. However, the corresponding influence on the V∞ is not significant because the adsorption time is faster than that of nucleation and diffusion process based on composition analysis of the tail gas.
Table 3 Coverage values of CH4 on surface of the substrate under varied temperature.

In the absence of H2 (the partial pressure of CH4 and Ar
are 5.7 and 95.6 KPa, respectively), the calculated coverage of
CH4 is 0.36% at 1273K. The corresponding coverage of CH4
decreases ~10% when H2 is added in the atmosphere (the
partial pressure of argon, hydrogen and CH4 gases are 57.4,
38.2 and 5.7 KPa, respectively), demonstrating that H2 rather
than Ar would depress the adsorption of CH4 on the FNR
surface. The adsorption of Ar atoms on the FNR is physical
adsorption because Ar gas is an inert gas. Inversely, both CH4
and H2 molecules can be decomposed on the FNR due to the
catalysis of transition metals, indicating that both the effective
adsorptions of CH4 and H2 are chemical adsorption [10]. Xu et al. and Watwe et al. studied the adsorption heat of CH4 and
H2 on Ni surface and calculated the needed dehydrogenation
energy of them [10,11]. The similar adsorption heat and
barrier height for dehydrogenation lead a competition for the
surface active sites of the FNR between CH4 and H2. In previous
reports, the influence of H2 on graphene growth was proposed
[5]: H2 molecules reduce the roughness of Ni substrates,
eliminate impurities (such as S and P) in the Ni substrates,
avoid local variations in the carbon dissolvability and remove
defects of graphene at high temperature. Meanwhile, thinner
graphene can be prepared on Ni surface when H2 was
introduced in the atmosphere. Koskinen et al. suggested that
the dangling bond of carbon atom in the graphene islands
would be terminated by hydrogen atom, which limited the
thickness of the resulting graphene [12].
Based on the results of this study, the reduced coverage
of CH4 shows that the influence from H2 on graphene growth
starts from the adsorption stage. The presence of H2 not only
terminates the dangling bond of graphene, but also depresses
the adsorption of CH4, which reduce the thickness of the asprepared
sample.
Kinetic control step of the 3DGNs
According to the calculated diffusivity of CH4 in the FNR
(~10 cm2s-1), CH4 can fill the FNR in several seconds. Therefore,
the 3DGNs should cover the whole surface of the FNR, which
contradicts to the experimental results. There are two possible
reasons can lead to this phenomenon: the CH4 is exhausted or
the dehydrogenation reaction only takes place at the endpoint
of the FNR. The result demonstrates that ~0.3% CH4 (the CH4
concentration is 4.1% before reaction) can be found in the tail
gas even the heat preservation time is as long as 2400s.
Therefore, the adsorption and dehydrogenation reactions of
CH4 only happen at the endpoint part of the FNR is the
fundamental reason. Diffusion velocity of CH4 is slower than
the velocity of adsorption and dehydrogenation reactions of
CH4 in the surface. The endpoint part of the FNR always
possesses enough active sites to chemisorb the CH4, and the
resulting carbon atoms diffusion into the FNR both along the
axial and radial directions. Thereby, the kinetic control factor
of the 3DGNs growth is the diffusion of CH4. The result
indicating that the thicknesses of 3DGNs should generally
reduce along the axial direction due to the concentration
gradient of carbon atoms in the substrate, which is proved by
our group [6,7].
Kinetic of 3DGNs growth
In the cooling process, the decreased solubility of carbon
atoms in the FNR leads to the formation of graphene on
substrate surface. According to the Langmuir-Mclean model
[13], the surface segregation process of carbon atoms
complies with the following equation:

where Cs and Cb represent the carbon atoms concentration on the surface and inner of the substrate. The ΔGseg is the segregation free energy of carbon atom, k and T represent the Boltzmann constant and temperature, respectively. In fact, the segregation of carbon atoms is a onedimensional diffusion process and the time-dependent equation is:

where Db is the diffusion constant. As for the initial and
boundary conditions, the Cs can be assumed as zero at the
beginning of the cooling process, and the initial Cb can be
considered as a constant at specified depth (
Cb (z > 0,t= o) C(x) , x represent the depth). The bulk
concentration of carbon atoms satisfies 0∫1C(x)dx = M , and
the M is the total amount of carbon atoms in the FNR, which
equals the change in the weight of the FNR before and after
CVD process. However, the ΔGseg is a function depending on
concentration of carbon atom and temperature, which is
difficult to calculate for the varied position of the FNR.
Moreover, the precise concentration of carbon atoms at
varied position of the FNR before and after cooling process
could not to be detected. Thereby, studying the growth
kinetic of the 3DGNs through precise calculation is difficult.
In order to simplify the related calculation and give a clear
physical picture, we suggest a parameter named “quasidiffusivity”
to describe the growth of 3DGNs. In this model,
the processes of adsorption and dehydrogenation of CH4 and
the processes of diffusion and segregation of carbon atoms
are deemed as an equivalent process: the 3DGNs growth in
the FNR surface directly. Therefore, the relationship between
the scale of 3DGNs and heat preservation time satisfies the
following equation:

D' is the "quasi-diffusivity", which is not corresponded to any actual process.
With the increased heat preservation time, the scale of 3DGNs increases. The length of the 3DGNs enhances to 2.46 cm from 0.94 cm when the heat preservation time increases to 2400s from 300s at 1273K condition (take right part of the FNR as an example, see inset of Fig. 3a). The calculated D' is 0.0028cm2s-1 for the sample with 300s heat preservation progress, which is about one-three thousandth of CH4 diffusivity, indicating that graphene can forms on the substrate surface only if the density of carbon atom in the FNR exceeds a certain value. By adopting the D' , the relationship between heat preservation time and scale of the resulting 3DGNs can be revealed. After comparing the calculated and practical values, it can be found that the fitting values can be used to predict the scale of the 3DGNs. However, the distinctions between the fitting and practical values become obviously when the heat preservation time is expended. Because the total amount of CH4 is unvaried, the amount of carbon atom diffusion into the substrate in unit time gradual reduces. Therefore, the D' decreases with the increased heat preservation time. By employing the identical method, the corresponding curve of the samples in the left part is calculated ( D' ~0.0041cm2s-1, is calculated by the sample with 300s heat preservation time, Fig. 3b). The digital image of the whole FNR after 2400s heat preservation time is displayed in the inset of Fig. 3b. The simulated and experimental results demonstrate that the length of 3DGNs can be designed by controlling heat preservation time, which is important to achieve the controllable growth of the 3DGNs. Moreover, based on the relationship between diffusivity and temperature (D~T1.51), the scale of the 3DGNs under varied temperatures is calculated (Fig. 3).
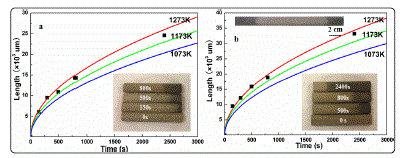
Fig. 3 Experimental and simulation results of the lengths of the 3DGNs from (a) right and (b) left sides of the FNR after varied heat preservation times.
In the cooling processes, due to carbon atoms at varied positions of the substrate possess identical segregation time, the different thicknesses of the 3DGNs results from varied densities of carbon atoms at varied positions. Based on “quasidiffusivity”, thickness of the 3DGNs at a specific position is proportional to ~ (t0 - d2/D where t0 and d represent heat preservation time and distance from the terminal of the FNR. Therefore, the relationship between thickness of 3DGNs and the growth position can be calculated. The simulated and real results of the 3DGNs in the two sides of the FNR with 2400s heat preservation time (1273K) are displayed in Fig. 4. The results show that the variation tendency of the thickness can be predicted by the curves, although the precision need improving. The “quasi-diffusivity” reduces with time, which results to the gradually increase deviation between the calculated and practical values. In order to obtain the better fitting results, the further optimization for the assumption and approximation is under study.
Conclusions
The diffusion and adsorption of CH4 on the FNR is studied. The diffusion of CH4 in the FNR complies Fick′s law. The coverage of CH4 decrease with increased temperature, and the presence of H2 further reduces the coverage of CH4 due to the competition for the surface active sites. Moreover, the growth kinetic of 3DGNs is studied. The diffusion of CH4 is found the kinetic control factor for the growth of 3DGNs. In order to simplified calculation, “quasi-diffusivity” was proposed to describe the growth process of 3DGNs. By adopting this parameter, the relationship between the scale of 3DGNs and heat preservation time can be obtained. Moreover, a preliminary study on the thickness of the prepared 3DGNs at varied position is performed. All the results manifest that the growth of 3DGNs can be predicted by “quasidiffusivity”, which is important to achieve the controllable growth of 3DGNs.
Acknowledge
This work was supported by National Natural Science Foundation of China under Grant (51506012), Jiangsu Science Foundation Fund under Grant (BK20150266); and the Basic Research Project of Changzhou City under Grant (CJ20159032).
References
- Tang B, Hu G.X. Two kinds of graphene-based composites for photoanode applying in dye-sensitized solar cell. J Power Sources. 2012;(220): 95-102. https://dx.doi.org/10.1016/j.jpowsour.2012.07.093
- Chen ZP, Ren CW, Gao LB, Liu BL, Pei SF, Cheng HM. Three-dimensional flexible and conductive interconnected graphene networks grown by chemical vapour deposition. Nat Mater. 2011;(10):424-428. doi: 10.1038/ nmat3001
- Li X, Cai W, Colombo L, Ruoff RS. Evolution of graphene growth on Ni and Cu by carbon isotope labeling. Nano Lett. 2009; 9 (12):4268-4272. doi: 10.1021/nl902515k
- Zhang WH, Wu P, Li ZY, Yang JL. First-principles thermodynamics of graphene growth on Cu surfaces. J Phys Chem C. 2011;115 (36):17782- 17787. doi: 10.1021/jp2006827.
- Meng LJ, Sun Q, Wang JL, Ding F. Molecular dynamics simulation of chemical vapor deposition graphene growth on Ni (111) surface. J Phys Chem C. 2012;116(10):6097-6102. doi: 10.1021/jp212149c
- Tang B, Hu GX Gaob H, Shic Z. Three-dimensional graphene network assisted high performance dye sensitized solar cells. J Power Sources. 2013; (234): 60-68. https://dx.doi.org/10.1016/j.jpowsour.2013.01.130
- Tang B, Hu GX. Preparation of few layers three-dimensional graphene networks by CVD for energy storage application. Chem.Vapor Depos. 2014 ;20 (1-2-3):14-22. doi: 10.1002/cvde.201207052.
- Wu SH, Wu CY. Time-resolved spatial distribution of scattered radiative energy in a two-dimensional cylindrical medium with a large mean free path for scattering. Int J Heat Mass Tran. 2001;(44):2611-2619.
- Ignatowicz K. A mass transfer model for the adsorption of pesticide on coconut shell based activated carbon. Int. J Heat Mass Tran. 2011;54 (23- 24): 4931-4938. https://dx.doi.org/10.1016/j.ijheatmasstransfer.2011.07.005
- Christmann K, Schober O, Ertl G., Neumann M. Adsorption of hydrogen on nickel single crystal surfaces. J Chem Phys. 1974; 60 (11): 4528-4540. doi: https://dx.doi.org/10.1063/1.1680935
- Watwe RM, Bengaard HS, Rostrup JR, Dumesic JA, Norskov JK, Theoretical studies of stability and reactivity of CHX species on Ni (111). Journal of Catalysis. 2000;189 (1): 16-30.
- Koskinen P, Malola S, Hakkinen H. Self-Passivating Edge Reconstructions of Graphene. Phys. Rev. Lett. 2008;101(11-12):115502-115505. doi: https://doi.org/10.1103/PhysRevLett.101.115502
- Mccarty KF, Feibelman PJ, Loginova E, Bartelt NC. Kinetics and thermodynamics of carbon segregation and graphene growth on Ru (0001). Carbon. 2009; 47 (7)1806-1813. doi: 10.1016/j.carbon.2009.03.004


