


Research Article
Deriving a Correlation of Cementation Factor in Nubian Sandstone Formation (Upper and Lower Cretaceous), Sirt Basin
1Libyan Petroleum Institute (L.P.I), Tripoli, Libya
2Department of Petroleum Engineering and Chemical Engineering, United Arab Emirates University, Al Ain, United Arab Emirates
*Corresponding author: Gamal Alusta, Assistant Professor, Department of Petroleum Engineering and Chemical Engineering, United Arab Emirates University, Al Ain, United Arab Emirates, E-mail: gamal.alusta@uaeu.ac.ae
Received: March 7, 2019 Accepted: March 29, 2019 Published: April 4, 2019
Citation: Sbiga HM, Alusta G. Deriving a Correlation of Cementation Factor in Nubian Sandstone Formation (Upper and Lower Cretaceous), Sirt Basin. Int J Petrochem Res. 2019; 3(1): 286-291. doi: 10.18689/ijpr-1000149
Copyright: © 2019 The Author(s). This work is licensed under a Creative Commons Attribution 4.0 International License, which permits unrestricted use, distribution, and reproduction in any medium, provided the original work is properly cited.
Abstract
The understanding of reservoir rock properties such as porosity, permeability, water saturation, and resistivity assists engineers to improve the characterization of the reservoir, and the cementation exponent m is an intrinsic property of the rock related to the geometry of the electrically-conductive water network imposed by the pore walls or surfaces of solid insulating materials. Archieʼs parameters, namely m, n, and a, are sometimes assumed constant to simplify petrophysical measurements. But these parameters are not constant, particularly in heterogeneous reservoirs. Inaccurate estimates of these parameters can cause significant errors in the calculation of water saturation when using Archieʼs equation and lead to discrepancies between log interpretation and production test results. There are many factors affecting cementation factor (m) such as porosity, pore throat size, type of rock grains, type and distribution of clay content, degree of cementation, and overburden pressure. This study has been undertaken in two oil fields: A-Libya, and B-Libya in the Sirt Basin located in Libya, the Nubian Sandstone formation is the main reservoir in these oil fields. Laboratory measurements such as porosity, and resistivity were conducted on core samples selected from two different fields. The results of electrical resistivity experiments are used to derive a new cementation factor correlation which can be applied to Nubian formations located in Sirt Basin. Crossplots of formation factor and porosity were created from measured data points for one hundred and ninty eight core samples. The analysis procedures for each field was made sequencely and finally, a good relation between formation resistivity factor and porosity for two fields and the correlations for calculation cementation factor were obtained for the Nubian sandstone formation, and the average Relative error of the data points when deriving these correlation was very small which indicates that these correlations are consistent.
Keywords: Porosity; Cementation; Geometry; Relative; Exponent
Introduction and objective
Core analysis is the only direct method for measuring and developing basic reservoir data to be utilised as the keystone in technological, financial events that follow and of successful reservoir engineering. Core information includes detailed lithology, microscopic and macroscopic definition of rock heterogeneity, capillary pressure data for defining fluids distribution in the reservoir and relative permeability for defining multiphase flow in the reservoir rock system, etc..., plays an important part in the evaluation and assessment of petroleum reservoir. Core analysis data have wide range of applicability in exploration, workovers, field development and reservoir engineering and evaluation. Obtaining high-quality core material and performing high quality core analysis program are absolutely crucial to the success of a rock characterization study. Porosity, permeability, fluid saturation, wettability and electrical properties of reservoir rocks are a set of fundamental properties by which the hydrocarbon reservoir rocks can be characterised. Porous and permeable rocks generally contain oil, gas and water. Porosity is one of the most important petrophysical properties, which is a measure of the storage capacity of hydrocarbon. Porosity is defined as the ratio of the pore space within the rock to the total volume of the rock. Porosity is created as a result of imperfect contact between rock grains.
Cementation factor (m)
The resistivity of rocks is a complicated function of porosity, permeability, ionic content of the pore water, and clay mineralization. Dry rocks are poor conductors; therefore, they normally exhibit extremely high resistivity [1]. Reservoir rocks are porous and their pores are generally saturated with water, oil and gas. The formation water normally has resistivity of 0.04 to 10 ohm.m at 70°F, which is much lower than that of the rock grains. As a result, they are conductors of moderate conductivity when they are saturated with water.
[2] found that the resistivity of 100% water saturated rocks is directly proportional to the resistivity of the water that saturates them.
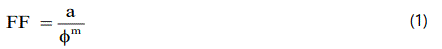
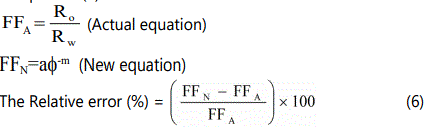
Where FF is the formation factor, a is the Archie constant, and Ø is the fractional porosity.
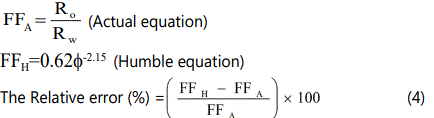
A strong dependence of formation resistivity factor on porosity was observed [2]. A large number of measurements on rock samples showed that the formation resistivity factor of shale-free rocks could be related to the porosity and texture of the rock. The Archieʼs cementation factor (m) has been found to vary from 1.3 to approximately 2.2 for unconsolidated and consolidated sands respectively [3]. The reason for the observed variation in cementation factor has been attributed to a number of factors such as degree of cementation, shape, sorting and packing of particles system [4] reported a similar relationship based on correlation of data from number of sandstone core samples. The equation derived by [3], known as Humble equation is
The cementation factor, m, indicates reduction in the number and size of pore openings or reduction in the closedoff _dead-end. channels. It has been widely used in hydrocarbon and groundwater exploration, and in porousmedia engineering studies [2,4-20].
The cementation factor exhibits wide variations from sample to sample, formation to formation, interval to interval in the same medium, and from medium to medium [21]. It Stated that m can vary in the mathematical sense between one and infinity, but practically, it lies within the limits of 1.3 and 3.0, as originally observed by [2,1]. It summarized different values for m, showing that m is affected by lithology, porosity, degrees of compaction and cementa- tion, and age [22]. It showed that m varies widely and changes continuously in the borehole due to variations in depositional subfacies. The general range of m, given in the literature, is between slightly less than one for fractured rocks [23,24] and 5.12 for well consolidated and highly compacted rocks [25].
In this paper, laboratory measurements such as porosity and resistivity were undertaken on core samples selected from two different fields (A, and B) from the Nubian Sandstone Formation. These measurements were conducted in order to obtain more realistic cementation factor for some sandstone reservoir core samples.
Methodology
Sample Preparation
One and half inch diameter core plugs were drilled in horizontal and vertical directions as using diamond core bit with water as the bit coolant and lubricant. The plug samples were extracted of hydrocarbons using toluene, leached of salt using methanol, and oven dried at 70 °C. The clean, dry samples were subjected to various analyses to determine porosity, permeability and grain density values where possible.
Porosity Measurements
The core analysis laboratory of the Libyan Petroleum Institute uses a twin cell helium expansion gas porosimeter for the plug sample grain volume measurement. The porosity and the grain density are then calculated by determining the bulk volume, and the weight of the sample.
Helium Gas Expansion Porosimeter
Core analysis laboratory of Libyan Petroleum Institute use a twin cell helium expansion gas porosimeter for the plug samples grain volume measurement. The porosimeter operates using the principle of Boyleʼs Law.
A sealed reference chamber in the instrument is filled with helium gas at ambient temperature to a pressure of 100 psig. A sample is placed in another sealed chamber, connected to the reference chamber by a two way valve. This valve when opened allows the gas in the reference chamber to expand into the combined volume of the two chambers. From Boyleʼs Law, The volume of the sample chamber can be calculated when the volume of the reference chamber, the initial pressure and the final pressure are known.
The instrument must be calibrated before using the porosimeter for analysis. This is done by running a series of stainless steel blanks of known volumes, to build up a graph of blank volume versus the inverse of the final pressure.
The resulted calibration graph has to be entered into a computer program which performs a linear regression, producing an equation relating the grain volume of any sample run to the final pressure reading. The porosity and the grain density were then calculated by determining the bulk volume, and the weight of the sample.
As a quality check, a suite of standard samples of known porosities and grain densities were measured every 20 samples.
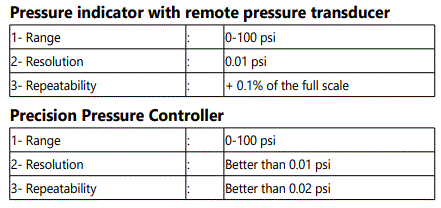
The instrument used by our laboratory has the following specifications.
Positive Displacement Pump
The positive displacement mercury pump is used to determine the bulk volume of each sample. The unit consists of a stainless steel high pressure pycnometer (sample container); it is attached to the volumetric pump cylinder. As the hand wheel connected to the pump is wound in or out, mercury is charged or withdrawn from the sample chamber. The volume of mercury displaced is measured linearly by a digital transducer connected to the pump. In practice, mercury is allowed into the pycnometer to a set reference mark, and the transducer set to zero. This process should be repeated several times to ensure accuracy. The mercury is subsequently released back into the pump and the sample is placed and sealed in the pycnometer. After that mercury is allowed back into the pycnometer up to the previously determined reference mark, and the display shown on the digital transducer noted. This value is later converted to the actual volume by using a simple correction factor derived from calibration volumes. The mercury is cleaned and the pump reset to zero at least once every four samples, depending on the sample type.
Formation Resistivity Factor at ambient Conditions
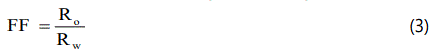
The formation resistivity factor was measured for one hundred and ninety-eight samples for two fields (A, and B). The clean and dry samples were loaded in a stainless-steel saturator and evacuated for 12 hours. A solution of (244 g/l for field A, and 170 g/l for field B) sodium chloride was introduced at the end of this period, followed by pressurizing the system at 2000 psi for 12 hours to assist penetration. The brine saturated plugs were placed in turn between electrodes at 1 KHz frequency and their electrical resistance were measured on consecutive days until ionic equilibrium was achieved between the fluid and rock sample. Formation resistivity factor measurements were made on 100 percent brine saturated core samples at ambient conditions and the elevated reservoir overburden pressure. The sample resistance was measured and converted to resistivity using the sample cross-sectional area and length. Formation resistivity factor is calculated as the ratio of the sample resistivity to the resistivity of the water saturating it. The formation resistivity factors of a group of samples are plotted versus their porosities on log-log graph paper. The slope of the best fit line is the value of the cementation factor, “m”, and the intercept is the value of “a”.
Interpretation of Results
1. The formation resistivity factor (F.F) was calculated for each well and for each field using the following equation :
2. The formation resistivity factor values were plotted against porosity values for each well.
3. The intercept value (a) and the slope (m) values were determined from the graph and the standard error was calculated as well.For each value of the intercept and the slope, the formation resistivity factor was calculated in each case by using equation (3).
4. The relative error between the actual equation (3) and Humble equation (2) was calculated.

Results and Discussion
Formation Resistivity Factor at ambient Conditions (Field A)
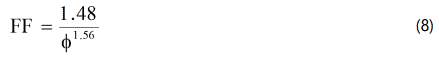
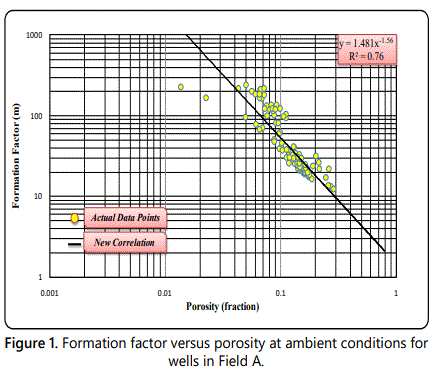
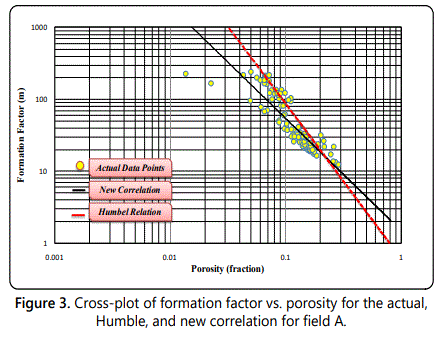
In field A, one hundred and seventeen representative sandstone core samples used had porosities between 1.3 % and 28.5 %. The samples were selected from depth intervals (15316 ft -15450 ft). The porosity, formation resistivity factor and cementation exponent of these samples at ambient conditions were measured and displayed in figure 1. The figure shows the formation resistivity factor versus porosity measured at ambient conditions. In the measured cores a well-defined relationship exists between formation resistivity factor and porosity. The cementation factor (m) was calculated for each sample. The average cementation factor for all core samples was calculated from the slope of the best fit straight line through the points and was found to be 1.56 and the correlation coefficient R2 was 0.76. The following equation represents the relation between formation resistivity factor (FF) and porosity (ø):
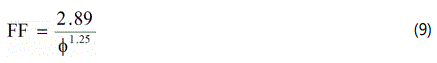
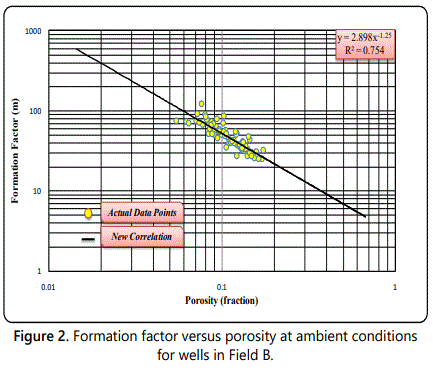
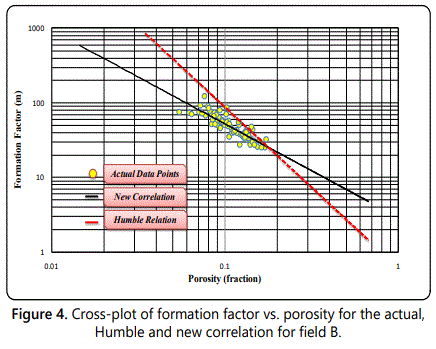
In field B, eighty-two representative sandstone core samples used had porosities between 5.45 % and 17.31 %. The samples were selected from depth intervals (13877 ft-13969 ft). The porosity, formation resistivity factor and cementation exponent of these samples at ambient conditions were measured and displayed in figure 2. The figure shows the formation resistivity factor versus porosity measured at ambient conditions. In the measured cores a well-defined relationship exists between formation resistivity factor and porosity. The cementation factor (m) was calculated for each sample. The average cementation factor for all core samples was calculated from the slope of the best fit straight line through the points and was found to be 1.25 and the correlation coefficient R2 was 0.75. The following equation represents the relation between formation resistivity factor (FF) and porosity (ø):
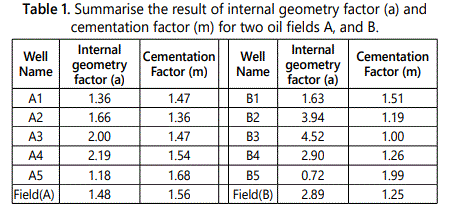
The result of parameters, a and m, in Table 1 appear increasing in values of cementation exponent as with decreasing of internal geometry factor (a) for most the wells. The internal geometry factor (a) value is controlled by the influence of tortuosity and the cementation factor (a) value is dominated by presence of cement. Cementation factor is much larger in cemented materials than in uncemented zones. These observed changes may result from changing the internal pore structure and increase in tortusity and decrease in the effective cross-sectional area that is an available to the flow of electric current.
It was observed from the result in Table 1 that the cementation factor for most of the wells varying between 1.0-1.99. A slight difference of cementation factor between field A&B were noticed which is approximately (0.31), this indicating that field- A has slightly greater cemented materials than field B. There is also difference in formation water salinity between the two fields where field A has a salinity of 154,000 ppm and field -B equal 121,000 ppm. This difference in salinity affects the formation resistivity factor and consequently cementation factor, because the formation factor depends on many parameters such as porosity, packing, sorting, pore size distribution, and irreducible water saturation.
Our results we observed that applying Humble equation for calculate the formation factor for the Nubian sandstone give a different result from the actual data. The formation factor which calculated from Humble equation is greater than the formation factor that calculated using the actual equation (F=RO/RW) for two fields especially in low porosity values. The explanation of this is that the Humble equation was derived based upon the observation of formation factor and porosity data for a particular formation plotting linearly on logarithmic scales.
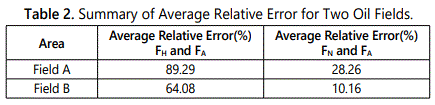
Where it was obtained by the measurements performed in 29 samples of North American sandstones. These core samples are consolidated sandstone sample. The internal geometry factor (a) and the cementation factor (m) define the characteristic properties of the formation, therefore are determined for individual formation. The parameters, (a) and (m) cannot be defined uniquely for a formation if there are too few porosity data available or the porosity range is too narrow. The average relative error mentioned in table2 for two fields A, and B are supports above concluded fact. We can note from the table that the average error by using Humble equation was high compared to the average error using derived correlations.
The values of internal geometry factor and cementation exponent are affected by many factors such as sorting, shape and packing of the system, pore size, tortuosity, and type of pore system (intergranular, intercyrstalline, vugy, fractured), compaction and clay content. These factors are varying from formation to another. This indicates that using Humble equation will give a large error in determining the formation the resistivity factor, which will lead to an error in the determining of water saturation. While the using of our correlation showed a very good matching with the Actual data points as it can be seen in Figures (3& 4).
Conclusions
A number of important conclusions can be drawn from this study.
1. More realistic values for the cementation factor (m) and the internal geometry factor (a) were derived from this study for the two fields representing the Nubian sandstone formation and by using Archie general equation. The proper correlations for these two fields are:
2. The average Relative error of the data points when deriving these correlations was very small which indicates that these correlations are consistent. 3. There is only a small difference between the cementation factor of both fields indicating that field –A has slightly greater cemented material then field –B and it is mainly due to the internal heterogeneity and more fractures in field –B which emphasize that these correlations are more applicable for the Nubian sandstone reservoir.
4. The Data obtained from experimental work give more realistic and accurate values of internal geometry factor and cementation exponent.
Nomenclature
a Archieʼs constant (Internal geometry factor)
A Cross-Sectional area Perpendicular to the direction of flow, cm2
FF Formation Factor (actual points)
FFH Formation Factor (Using Humble equation)
FFN Formation Factor (Using suggestedcorrelation)
L Length of sample, cm
m Cementation factor, dimensionless
r Resistance, ohm
R Resistivity, ohm.m
Ro Resistivity of fully saturated rock, ohm.m
Rw Water resistivity, ohm.
Greek Symbol
Ø Fractional Porosity
Acknowledgment
We wish to thank the Libyan Petroleum Institute for access to their facilities to undertake the core measurements, and for providing some relevant supplementary data. We would like to thank and United Arab Emirates University who supported with any kind of help, ideas and advice during this project.
References
Contact us for any additional information - contact@madridge.org
 Madridge Publishers is licensed under a Creative Commons Attribution 4.0 International License.