Research Article
Effect of Well Completion, Slug Size and WAP Timing on the Performance of Polymer Flooding
1Department of Petroleum Engineering and Chemical Engineering, United Arab Emirates University, Al Ain, United Arab Emirates
2Teaching Assistant, Department of Petroleum Engineering, Abu Dhabi Polytechnic, United Arab Emirates
*Corresponding author: Gamal Alusta, Assistant Professor, Department of Petroleum Engineering and Chemical Engineering, United Arab Emirates University, Al Ain, United Arab Emirates, E-mail: gamal.alusta@uaeu.ac.ae
Received: March 6, 2019 Accepted: March 25, 2019 Published: April 1, 2019
Citation: Alusta G, Saqer R, Mohsen H. Effect of Well Completion, Slug Size and WAP Timing on the Performance of Polymer Flooding. Int J Petrochem Res. 2019; 3(1): 280-285. doi: 10.18689/ijpr-1000148
Copyright: © 2019 The Author(s). This work is licensed under a Creative Commons Attribution 4.0 International License, which permits unrestricted use, distribution, and reproduction in any medium, provided the original work is properly cited.
Abstract
The objective of this work is to asses and select the development options using polymer process that maximize oil recovery for a synthetic reservoir model where technical parameters are optimized thoroughly. Reservoir simulation study using ECLIPSE 100 was used to simulate the synthetic model to investigate the different development options of polymer flooding applied and compare them to water flooding. The development options include continuous polymer injection, water alternating polymer, and polymer slug injection. Through the study, the effect of injection rate, polymer concentration, slug size, and well completion were investigated by setting up a range of sensitivities.
Keywords: Slug Size; Oil recovery; Injection rate; Polymer concentration.
Abbreviations: FOE: Field Oil Efficiency (%); FOPR: Field Oil Production Rate (STB/D); FOPT: Field Oil Production Total (STB); FPR: Field Pressure (psia); FWCT: Field Water cut (dimensionless); FWIR: Field Water Injection Rate (STB/D); FWPT: Field Water Production Total (STB); WCIR: Field Polymer Injection Rate (LB/D); WCPT: Field Polymer Production Total (LB).
Introduction
The life of an oil reservoir goes through three distinct phases namely primary, secondary, and tertiary or enhanced oil recovery. The importance of EOR techniques is to improve the displacement efficiency by reducing the residual oil saturation that results in high ultimate oil recovery [1].
Polymer flooding is one of the mostly used chemical EOR methods. It uses polymer solutions to increase the viscosity of the displacing fluid and/or reduce the effective permeability of rock to the injected fluid and thus lower the displacing fluid (water)/oil mobility ratio leading to an increase in oil recovery. After normal water flooding, polymers maybe injected for one to two years to effectively reach the residual oil saturation; since polymer flooding does not affect the end point Sor, a reduction in the effective Sor is achieved at the economic limit. This reduction is dependent on the nature of the fractional flow curve and the volume of injected water [2].
Exponential increase of polymer flooding projects has been due to the affordable price of polymers compared to oil; where the mostly used polymers by the industry are hydrolyzed polyacrylamides (HPAM) and biopolymer xanthan [2,3].
The primary mechanism of a polymer flood is to increase the volumetric sweep efficiency by means of mobility control. Furthermore, the implementation of polymer process reduces fingering effect which is a main problem in water flooding application. By doing so, the volumetric sweep efficiency increases [4].
In this paper, engineering design aspects of polymer flooding were analyzed and identified to assess full field development options for polymer injection that will achieve ultimate recovery.
Development Options Identification
The assessment and selection of the development option that will maximize the oil recovery needs to be defined through viable development options and processes.
In defining the constraints, all dependent variables that will affect the results of the study will be considered [5].
In this study, two development processes were identified: water flooding and polymer flooding.
For the polymer flooding process, the following development injection plans will be identified for analysis:
Through the study the effect of injection rate, polymer concentration, polymer timing and well completion were studied.

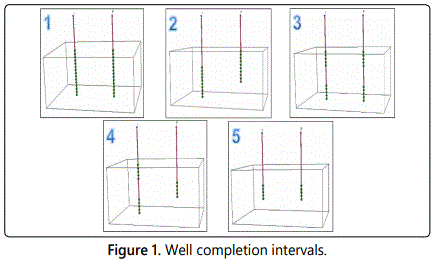
A total of 133 simulation runs were prepared and run using the ECLIPSE 100 simulator. Figure 2 is a flow chart representing the development processes of polymer flooding throughout the study, where the output from the water flooding sensitivity analysis will be fed as an input in terms of optimum injection rate and best completion practices.
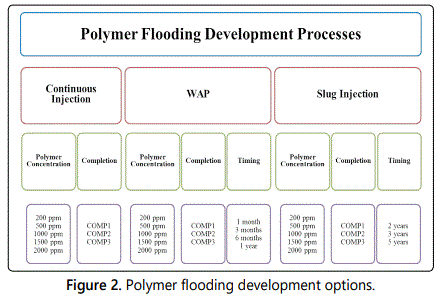
Development Process Assess Study
Water flooding process
For the water flooding process, the prediction runs were simulated by studying the effect of injection rate and well completion.
Injection rate sensitivity analysis: The base case completion (COMP1) was set for all runs to study the effect of various injection rates on the performance of the water flood where 2000 STB/D is the base case injection rate.
The results of the five simulation runs are shown in table 2.
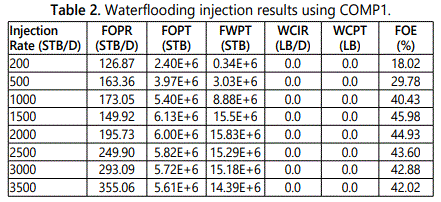
Based on the illustrated results, the following can be deduced:
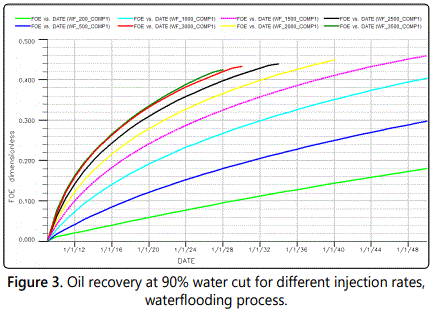
According to what has been found, the maximum oil recovery was achieved at an injection rate of 1500 STB/D, with 1.05% difference from the base case injection rate (2000 STB/D). Injection rate of 200 and 500 STB/D are considered to be too low and they delay the breakthrough with bad recovery compared to other injection rates. Fast breakthrough was observed at 2000 STB/D and at higher injection rates as shown in recovery profile at 90% water cut using different injection rate as in figure 3. Thus, 1500 STB/D was considered the most suitable operating injection rate for this study.
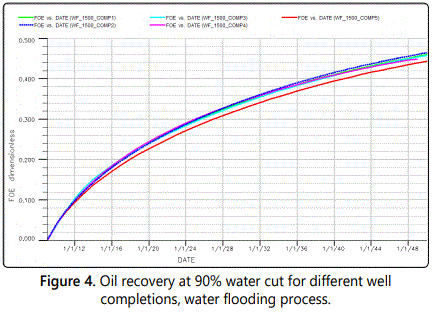
Well completion sensitivity analysis: The results of five completions attempted at an injection rate of 1500 STB/D are shown in table 3.
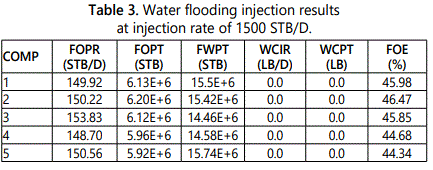
The main findings can be summarized as follows:
Based on that, the first three completions will be used in the technical sensitivity analysis of different development options of polymer flooding.
Polymer flooding process
Continuous polymer injection: A total of fifteen runs were simulated where figure 5 shows the oil recovery obtained for different polymer concentrations corresponding to the three completions attempted.
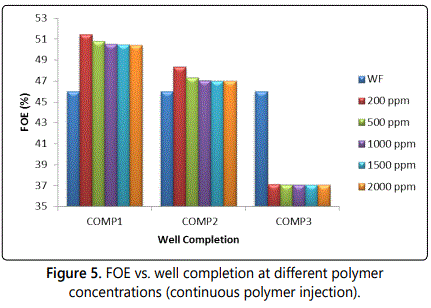
A 5.45% increase in oil recovery is obtained over water flooding once polymer injection is applied at minimum concentration of 200 ppm using COMP1. On the other hand, completing the well using COMP3 reduces the oil recovery by 8.85% respectively over water flooding at minimum polymer concentration used. This can be justified due to perforating both the injector and producer in the two geological layers of low permeability, where the continuous injection of polymer solution in this case leads to pores blockage even at low concentrations of polymer. As a result, COMP3 will not be utilized as an option to improve oil recovery and completing the well at all layers for injection and production gave the highest recovery for all polymer concentrations attempted.
Furthermore, reducing the polymer concentration from 2000 ppm to 200 ppm improved the recovery by 1% using COMP1 and by 1.38% using COMP2. It is necessary in this case to choose and select the appropriate polymer concentration to be injected in order to minimize extra costs, since the effect of increasing polymer concentration beyond a certain value will not be sound. Based on theory, fingering can be avoided by continuous injection of polymer solution instead of water. This will improve the mobility of the injectant; thus, increases the oil recovery efficiency. But since the polymers are more expensive than water, this will limit the volume of injected polymer solution. In most cases, continuous injection of polymer is not economical.
Polymer injection could be resumed after 2050 since water cut economic limit of 90% has not been reached while for water injection it has been. At 2050, an average water cut is reached of about 65%, 55% and 35% using COMP1, COMP2, and COMP3 respectively.
Water alternating polymer (WAP) injection: Sixty simulation runs were performed to study the effect of implementing WAP injection; different WAP time cycles, polymer concentrations and well completions were examined.
From the simulation runs, similar results were observed during the WAP process for all WAP cycle time intervals attempted using COMP1. Increasing the polymer concentration from 200 to 2000 ppm has an adverse effect on the oil recovery; thus, an increment of 8.1% in oil recovery can be attained using 200 ppm when it has been injected as a slug of 0.00704 PV alternating with the same pore volume of water.
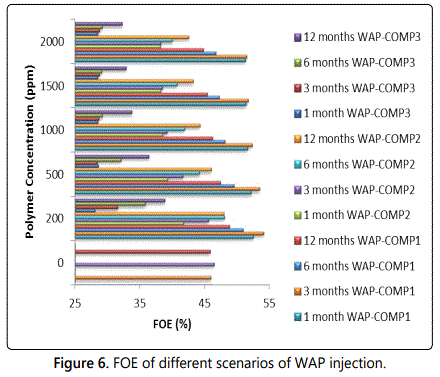
The effect of injecting different pore volumes of water followed by the same pore volume of polymer solution (WAP ratio 1:1) including 0.00235, 0.00704, 0.014, and 0.0285 where each denotes that both slugs (water and polymer solution) will last for one, three, six, and twelve months respectively, keeping both the polymer concentration and the selected completion constant is significant. A summary of the FOE results is illustrated in figure 6. From the results presented, the following points can be deduced:
Results and Discussion
The overall results of the simulation runs attempted using COMP2 are presented in figure 6. In this case, the minimum requirements in terms of polymer should be considered to increase the recovery over normal water flooding. The results reveal that in order to obtain higher recoveries when COMP2 is applied, the study period needs to be extended and this is applicable; since 90% economic limit of water cut has not been reached. Referring to the results obtained using COMP1, higher oil recoveries are achieved over COMP2 for the same WAP cycle intervals; keeping the reservoir pressure maintained throughout the study.
Also, it has been observed that the injection rate was not maintained at the desired rate of 1500 STB/D and it has been reduced as the process of injection is going on; since it canʼt sustain the pressure in the reservoir. Moreover, maintaining constant injection rate of 1500 STB/D throughout the flood was attempted, leading to a sharp increase in pressure exceeding the fracture pressure of the formation.
In addition, injecting relatively larger slugs in the WAP process when COMP2 is applied increased the oil recovery by 1.63% and 1.49% when 0.014 and 0.0285 PV were injected respectively both at 200 ppm. Hence, the water cut has not reached the 90% limit at 2050; leading that the WAP process in this case can recover more oil where the project needs to be implemented for further time.
When COMP3 is attempted, the following results were observed:
Generally, the results reveal that COMP3 is not favorable to be implemented as a WAP process. Moreover, what has been recovered at 2050 by water injection is much more promising technically and economically.
Extending the project for another 50 years may lead to favorable results in terms of FOE, since the water cut is still below 60% in the extreme case (200 ppm, 1 year WAP injection).
A comparison between the different options is presented in figure 6 in terms of oil recovery versus different polymer concentrations ranging between 200 to 2000 ppm for all completions and WAP injection time intervals (different PV).
As shown, COMP1 gave the highest oil recovery ranging between 46.25% using 1000 ppm when 0.0285 PV is injected to 54.08% using 200 ppm when 0.00704 PV is injected. Moreover, the oil recovery increases with lower polymer concentration used.
Furthermore, the least recovery was obtained when each slug of water and polymer solution is injected for a year and the highest is when both slugs are injected for a period of one and three months, this is applied when COMP1 is used.
In general, as polymer concentration deceases as well as the WAP timing decreases, improvement in recovery is attained using COMP1. The opposite occurred using COMP2, where increasing the slug size is favorable in this case at low concentration of 200 ppm. Furthermore, COMP3 showed unfavorable results for all cases, and improvement in the sweep efficiency is not attained.
In here, it should be noted that since the WAP ratio is 1:1; this means that equivalent volumes of water and polymer are injected and the only difference in this case is the slug size of the injectant.
Therefore, implementation of WAP process at small time interval of one to three months (0.00235, 0.00704 PV) gave the highest oil recovery where COMP1 is used at relatively low polymer concentrations of 200 ppm.
Polymer slug injection: To implement polymer slug injection, forty-five simulation runs were simulated at different polymer concentrations, well completion, and polymer slug sizes.
The slug size in this case is 0.0685, 0.0856, and 0.143 PV which corresponds to two, three, and five years of polymer injection. The polymer slug injection started after implementing water flooding for two years; then the run will proceed with water injection.
At the start of the flood, the reservoir pressure decreases and as soon as the injected solution started to breakthrough, the pressure raised a little bit. During the polymer injection period, the pressure is decreased and maintained. The following inferences can be drawn regarding the implementation of COMP1 using different concentrations and slug sizes:
Completing the injector and producer as stated by COMP2 and applying the polymer injection for a period of two, three, and five years respectively; reveal the following findings:
When the well is completed using COMP3; the maximum oil recovery of about 48% is obtained by the use of 500 ppm when the polymer slug is injected for three years. Also, it has been observed that marginal differences encountered between 200 ppm and 500 ppm when the polymer in injected for the same period; where the selection of the best option will be based on the economic study. Injecting polymer for two and five years didnʼt recover extra oil over the water flooding process. Two years injection was not enough to sweep the oil and increment the recovery; hence comparable results with the water flooding option were obtained.
Furthermore, a reduction in oil recovery is observed when polymer slug injection for five years is implemented at the different concentrations during the project time period. This could be referred to the well completion used were both wells (injector and producer) are completed in geological layers one and three with relatively low permeability when compared to the middle one; causing a blockage of the pores when it has been interacted with the formation, leading to inefficient sweeping of the oil.
A comparison between the different options attempted as polymer slug injection is presented in figure 7 in terms of FOE versus different polymer concentrations ranging between 200 and 2000 ppm, for the three well completions investigated, and polymer injection period (different PV).
The maximum oil recovery could be achieved by implementation of polymer slug injection after two years of water flooding for a period of two years using COMP1, and by injecting 1000 ppm of the polymer solution. Furthermore, injecting the polymer solution at high concentrations of 1500 ppm and 2000 ppm is not beneficial as well as completing the well as in COMP3, where both the injector and producer are completed in geological layers one and three.
Generally, COMP3 is not recommended to be used as an option to maximize the oil recovery by polymer flooding.
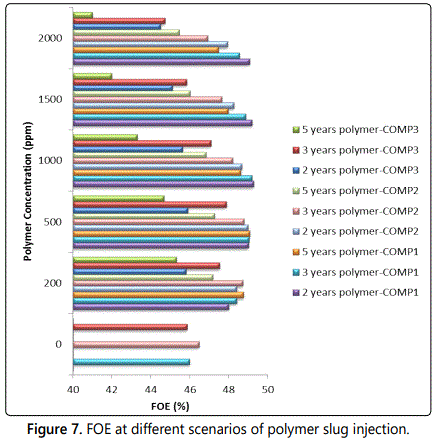
In general, the required volumes of polymer solution to be injected using the slug injection process is less than the other two options including continuous polymer injection and WAP injection. Also, through the polymer slug injection sensitivity analysis; the water cut approaches its economic limit of 90% in 2050. Therefore, when the polymer is injected in a continuous basis or as equally alternating slug with water; the economic limit of water cut is still not reached. This lead that extending the study period for more than 41 years could improve the oil recovery; keeping in mind that any decision is based on the management and business plan of the project.
Conclusions
The results of this study lead to the following conclusions:
References