Research Article
Development of an Appropriate Model for predicting Pore Pressure in Niger delta, Nigeria using Offset Well Data
Department of Petroleum Engineering, University of Benin, Nigeria
*Corresponding author: Abubakar Tanko, Department of Petroleum Engineering, University of Benin, Nigeria, E-mail: abubakartanko87@gmail.com
Received: February 28, 2019 Accepted: March 23, 2019 Published: March 29, 2019
Citation: Tanko A, Bello K, Tanko I. Development of an Appropriate Model for predicting Pore Pressure in Niger delta, Nigeria using Offset Well Data. Int J Petrochem Res. 2019; 3(1): 274-279. doi: 10.18689/ijpr-1000147
Copyright: © 2019 The Author(s). This work is licensed under a Creative Commons Attribution 4.0 International License, which permits unrestricted use, distribution, and reproduction in any medium, provided the original work is properly cited.
Abstract
The pore pressure in most sedimentary formations such as it is in the Niger Delta, Nigeria are rarely normal. They predominantly occur as over-pressured zones, when these abnormal pressures are not predicted accurately prior to drilling, disastrous occurrences, such as kicks, and blowouts may occur. The existing models used for pore pressure predictions were developed using data outside Niger Delta environment as such a number of them yield inaccurate results. This paper provides a new approach for predicting pore pressures particularly for Niger Delta using offset well logs acquired in the Niger Delta. A number of industries utilized pore pressure prediction models were appraised using offset well data from the Niger Delta. Density and sonic velocity logs were used in generating the overburden pressure and Normal Compaction Trend. Shale trend and overburden pressure were used as inputs in the models for predicting pore pressure using RokDoc.
In the development of an appropriate model for pore pressure prediction, Eaton model was modified for Niger Delta environment. Results of the modelʼs sensitivity analysis revealed sonic velocity as the most sensitive parameter while findings from the Goal Seek analysis showed that increasing the exponent in the original Eatonʼs model from 3 to 3.9 yielded the most concordant result with the measured pressure data. The statistical error analysis conducted revealed that the modified Eatonʼs model had the least absolute mean percentage error value of 2%. Given the above results, the modified Eatonʼs model showed more accurate predictions when compared with existing models and will be effective in predicting pore pressure in the study area.
Keywords: Pore Pressure; Niger delta; Model
Introduction
The forecast of pore pressure plays a crucial role in the planning and actual drilling phase of a hydrocarbon well. Pore pressures determine where the casings are placed in the well and the magnitude of drilling mud to use in the course of drilling the well. In an over-pressured region such as the Niger Delta, accurate prediction of formation pore pressure can greatly curtail non-productive time and destructive problems associated with drilling through over-pressured areas such as wellbore balance complications, influx of pore fluids into the well, blowouts, and lost circulations. As such, accurately predicting the pore pressure of the area will help to ensure an improved well design, mud weights program, risk assessment and field development plan. Pore pressures prediction in shale is an intricate process as it canʼt be evaluated directly and requires inference from seismic velocities or acoustic travel time [1]. Baltensperger PZ [2] stated that erroneous estimation of hydrocarbon reserves can occur due to inaccurate forecast of formation pressures. Techniques employed in evaluating abnormal pore pressures are separated into three categories; prediction methods, direct methods and detection techniques [3]. The prediction methods normally employ data acquired from nearby well logs, seismic studies, and general well records. These techniques are primarily used in the course of searching for hydrocarbons. The direct methods basically employ the use of wire line formation testers such as Repeat Formation Testers, and Modular Dynamic Testers to measure pore pressure directly from permeable formations. Meanwhile the detection methods primarily make use of drilling data acquired in the course of the drilling operation of wells which can be observed for pressure anomalies [4]. The basic principle of predicting pore pressure is based on Terzaghi's effective stress theory [5] which states that pore pressure is dependent on the overburden pressure and the effective stress. It is predicted by deducting the effective stress from the overburden pressure.

Where Sv is overburden pressure
σ Is effective stress
Pp Is the pore pressure
Niger delta geology
The Niger Delta basin is one of the seven sedimentary basins in Nigeria. It is considered as the most significant owing to its petroliferous nature and consequent active hydrocarbon exploration and production operations occurring both onshore and offshore. The Niger Delta basin has three major formations namely, the Agbada, Akata and Benin Formations. The Benin Formation is the uppermost consisting of considerable amounts of non-sea sand predominantly sandstone together with deposits of gravels [6]. The formation contains negligible amounts of hydrocarbon [7]. The Agbada Formation lies beneath the Benin formation and overlies the Akata Formation. The formation encompasses reservoir rocks and seals. The Akata Formation, which is at the base is about 7000 m thick and consists of basically clay and shale. The formation is rich in organic matter and is believed to be the major rock generating hydrocarbons in the study area.
Methodology
The data employed in this work was from a well situated in Niger Delta. Data used primarily consisted of wireline logs such as sonic compressional velocity, density, and gamma ray logs along with direct measured pressure data in the form of Repeat Formation Test (RFT) data. The tools employed for this study were RokDoc package and Microsoft Office Excel. The RokDoc package was used for the estimation of overburden pressure, normal compaction trend generation, selection of shale intervals, pore pressure forecasts, and carrying out an analysis of sensitivity using scatter-plots. Microsoft Office Excel (Goal Seek) was used in the calibration and optimization of the best pore pressure forecasting model and the statistical analysis to ascertain the models' precision and subsequently rank them. The basic workflow employed in the work is as follows;
Overburden stress
The overburden pressure is a pre-requisite for forecasting pore pressure in most models. Overburden pressure in the study was computed from density log by taking the accretive sum of weight of sediment at every depth. The overburden pressure was estimated using a model fit of the density log (Rho fit) by employing the RokDoc package using the equation.

Where Rho(Zml) density at depth z below ground surface (mudline).
RhoMatr=density of matrix
RhoTop=density at mudline (ground level)
b=Compaction coefficient (1.5 × 10⁻⁴ ft)
Shale trend
This is primarily used as a filter in selecting clean shale for the generation of Normal Compaction Trend line. Given that most compaction occurs in the shale formations, and a compaction trend is crucial to pore pressure prediction, only the cleanest shale lithology is used. To achieve this, a volume fraction of shale is generated using Gamma Ray log with the aid of the RokDoc package since the Gamma Ray log can discriminate between sand and shale lithology. Data points used for the analysis were further screened by virtue of choosing a shale fraction value of 50%. Data points with lesser values than the gamma ray from shale discrimination line are discarded, with the remaining points utilized. The volume fraction of shale, Vsh, is generated from the RokDoc package using the equation.

where GRlog is the response of the gamma ray log
GRshale is the measurement obtained in clean shale
GRsand is the log measurement in clean sand.
Normal compaction trendline
This is a linear correlation between properties of shale such as sonic velocity with depth of burial. The generation of the normal compaction trend is crucial since prognosis of pore pressure in some models is determined by comparing the measured log data with the corresponding value of that measurement in a normally compacted formation. The normal compaction trendline in this study was established from the compressional velocity, Vp log. It was generated in the RokDoc package using the reciprocal input log transform of compressional velocity, Vp.

where VpTop is the compressional sonic velocity at the surface (ft/s).
VpMatrix is the compressional sonic velocity at maximum extrapolated (ft/s),
b is the compaction coefficient (1.5 × 10⁻⁴ ft-1)
Hydrostatic pressure
The hydrostatic pressure was computed by multiplying the normal pressure gradient of the study area by the depth of interest. A pressure gradient of 0.433 psi/ft was used in the project.

where Phyd is the hydrostatic pressure.
TVD is the true vertical depth (ft).
Prediction of pore pressure
A number of models were employed in the study for the prediction of pore pressure using primarily the sonic velocity, Vp logs. The models used are Eatonʼs, Bowers, and Equivalent Depth. These models were chosen based on their compatibility with the sonic compressional velocity log data. Parameters such as the estimated overburden pressure, hydrostatic pressure, and normal compaction trend were utilized as inputs in the models. The RokDoc package was used for the prediction of the pore pressures.
Eatonʼs method (1975): The model was developed according to the effective stress concept of Terzaghi K [5], which correlates pore pressure to the difference between effective stress and overburden pressure. The model is one of the most widely utilized methods for predicting formation pressure using well logs in the industry [4]. Basically the model correlates pore pressure to well log data such as sonic velocity, interval travel time or resistivity. The model generally compares an observed petrophysical property say velocity to its equivalent in a normally compacted formation at the same depth. This is done by finding the log data ratios and multiplying them to the effective stress. Subsequently formation pressure can be determined using the Terzaghi correlation. The model requires both a line of best fit along normal pressured data (NCT) and an Overburden pressure for its computation. The model is most effective in formations where under compaction is the primary reason for high pressures. The model was developed as a means of upgrading the [8] method which is devoid of overburden influence in its formulation.

where Pp=predicted pore pressure in psi.
Pobs=overburden pressure
Phyd=hydrostatic pressure
Bowers model: The model represents a correlation of effective stress with velocity that could be utilized to associate sonic velocity to formation pore pressure [9]. Bowers stated that a power relationship exists between velocity Vp and effective stress σe'.

where Vo=velocity of unconsolidated fluid saturated sediments (about 5000 ft./s=1524 m/s) in Niger Delta.
Vp=compressional sonic velocity A and B are constants which describe the variation in velocity with increasing effective stress. Where A and B are assumed to be 0.69 and 1.0 respectively.
Equivalent depth method (1966): The model was formulated on the premise that formations with equal physical properties at different depths will have an equal effective stress, hence the pore pressure can be inferred at each depth of investigation since the value of the petrophysical property depends on the effective stress [10].
If the overburden pressure for point A (Povb,A) is known, the pore pressure at A (Pp,A) can be calculated.
where Pp is Pore pressure.
Povb is the overburden pressure
σA Effective Stress at A.
σB Effective Stress at B.
A and B=depth of interest and depth on the best fit normal compaction line where the measured data corresponds to that the depth of investigation.
Sensitivity analysis
The methodology adopted for the analysis of sensitivity in the work was the use of scatter plots. This entailed plotting the output variable (pore pressure) against the individual input variables of the pore pressure forecasting models such as Vertical effective stress (VES), and the sonic compressional velocity (Vp). The analysis was done using RokDocʼs data calibration function.
Development of model
This involves selecting the model with the best pore pressure prediction and modifying the previously identified sensitive variable (Vn) against the measured pressure data (Repeat formation Tester) to enable the model yield better predictions using Excelʼs Goal Seek function.
Prediction performance of Models
In order to ascertain the accuracy of the pore pressure predictive models, the percentage error of the results obtained from the models was computed using the equation below.

Results and Discussion
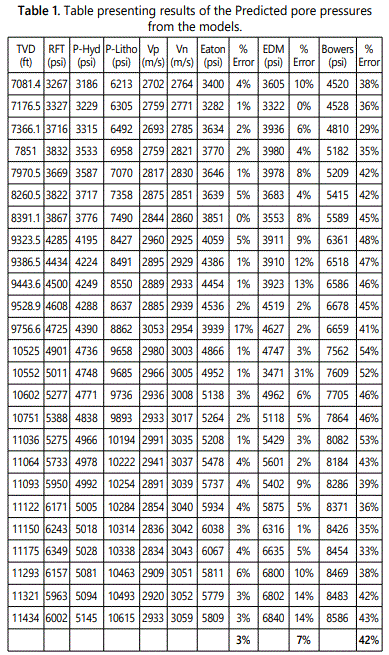
The evaluated overburden pressure and computed normal compaction trend are showcased in table 1 below.
Prediction of pore pressures using various models
The outcome of the pore pressure forecast in the study area using the three (3) models are presented below in figure 1. By using the generated Normal Compaction trend (NCT) and Overburden pressure profile as inputs in the models, the pore pressure pressures were predicted using Rokdoc. The predicted pore pressures were analyzed with the measured pore pressures (RFT) at various depths to ascertain the accuracy of the models (Table 1).
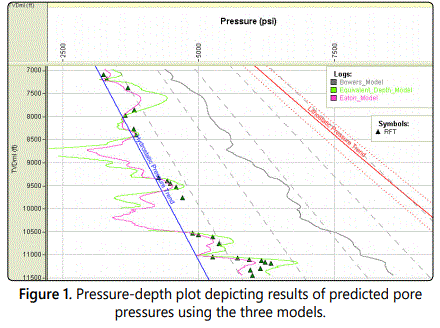
The multicolored curves between the hydrostatic pressures and overburden pressures are the prediction results. As depicted in the plot above, the Eatonʼs model [11,12], represented by a purple wavy curve coincides with the measured pressure at depths of 7176 ft to 9443 ft but did not accurately match the measured pressure at deeper depths between 9528 ft and 9756 ft where there were reversals in the predicted pore pressures [13]. However, at depths of 10524 ft to 11093 ft there were close matches between the predicted results and the measured pressure data, with the only reversal at 10751 ft. At deeper depths, the model under-predicted the pore pressure [14]. The Equivalent-Depth modelʼs predictions (green curve) closely matched the measured pressure data from 7176 ft to 11063 ft but over-predicted the pore pressure at depths of 11093 ft to the final depth (11434 ft). Bowers models represented by grey curves respectively overpredicted the pore pressures from the initial depth up to the final depth of interest in the well.
Sensitivity analysis results
Below are the results of the sensitivity analysis conducted on the best model (Eatonʼs) using scatter plots to illustrate the correlation between the modelʼs input variables (vertical effective stress, and sonic compressional velocities) and the desired output, figure 2 being the measured formation pore pressure (RFT) data [15].
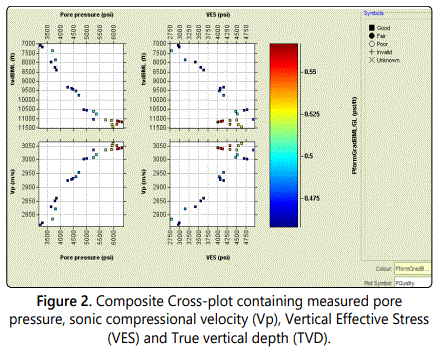
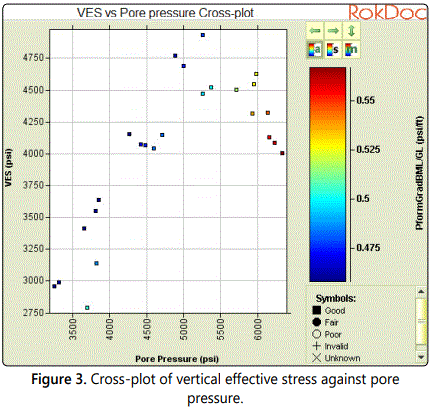
In all the scatter plots, the points are colored using another parameter being the formation pressure gradient and the plot symbols represent the measured pressure quality [16]. The scatter plot of compressional velocity (Vp) against pore pressure (bottom left) showed that sonic compressional velocity has a strong influence on the pore pressure as both parameters increased together thereby implying a positive correlation (Figure 3). The scatter plot of vertical effective stress (VES) and pore pressure also showed a positive correlation for the most part but later exhibited a negative correlation (reduction of Vertical Effective Stress with a rise in pore pressure). The cross-plot of sonic velocity (Vp) against VES equally yielded a positive correlation with points slightly spread out across plot. However the data appears more scattered on the plot implying the correlation is not very powerful. Lastly both the measured pore pressure and vertical effective stress have a positive correlation with depth as they both increase with it. Overall it can be surmised that all model input parameters are crucial to the pore pressure predictions of the models but the parameter with the most effect on the pore pressure forecast appears to be the sonic velocity (Vp) owing to its positive correlation with the pore pressure. Furthermore, the sensitivity analysis has also shown that the sonic velocity has a significant effect on the vertical effective stress (VES) which in turn has a good influence on pore pressure since Pp=Pob-VES. As such the subsequent model optimization would zero in on this parameter for improved model performance.
Optimization of formation pressure prediction model
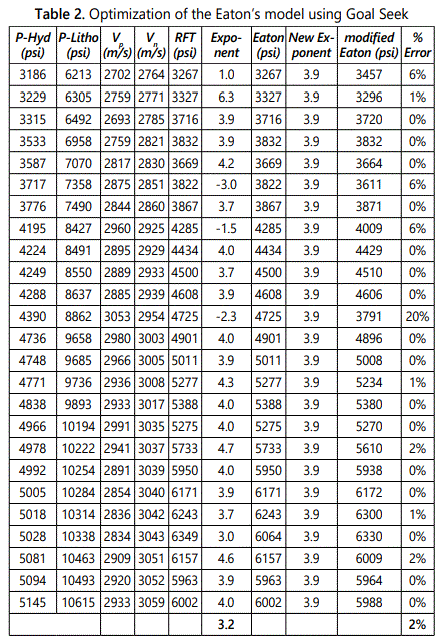
Eatonʼs model was chosen for the optimization as its pore pressure predictions had the closest match with the measured pressure data and consequently the least percentage error of the ten models used in the work. The optimization basically involved modifying the most sensitive variable in the model (Table 2). The sonic compressional velocity (Vp) was observed as the most impactful variable, hence it was focused on for the optimization. Given that an exponent (3) was attached to the sonic velocity data, the optimization was done by modifying this exponent using Goal Seek to calibrate the modelʼs prediction with the RFT data. The result showed that the best exponent for most data points fell between 3.9 to 4.0. and the mean of the exponent was 3.2. By iteratively trying different exponents ranging from 3.2 to 4.0 in place of the exponent 3 used in the original Eatonʼs equation, an exponent of 3.9 yielded the best fitting match.

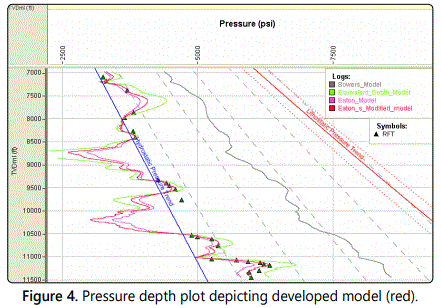
From the plot it is seen that based on the comparison of each pore pressure prediction model against the measured pressure data and the statistical analysis described above, the most accurate and suitable pore pressure prediction strategy for future use in Niger Delta environment is the developed Eatonʼs model (Figure 4).
Conclusions
The study involved the development of a new model for prognosis of pore pressures using well logs from an exploratory well in Niger Delta. The approach slightly varies from existing pore pressure forecasting techniques given that the model was developed for usage in Niger Delta environment. Three models were appraised with various degrees of accuracy. The predictive accuracy of the models was validated by comparison with measured pressure data (RFT) and computation of percentage errors. The modified Eatonʼs model gave the best correlations with the RFT data in comparison to the other models used. The sensitivity analysis done on the Eatonʼs model revealed the sonic compressional velocities have the most effect on the pore pressures, as such the modelʼs optimization centered on the sonic velocity by virtue of modifying the exponent. By utilizing Goal Seek to calibrate the predicted pore pressures with the RFT data, an exponent of 3.9 was found to be the most apt for optimum formation pressure prediction which resulted in the least percentage error of 2%. This further validates the suitability of the developed model for usage in the study area. This study will aid in the selection of an accurate model suited for forecasting pore pressure in Niger Delta environment.
References