Research Article
Variants of Specific Surfaces in the Bakoven Member: Union Springs Formation of the Marcellus Subgroup in Central New York State (USA)
1Department of Geosciences, University of Technology Petronas, Malaysia
2State University of New York, Geneseo, USA
*Corresponding author: Fosu-Duah Evelyn Love, Department of Geosciences, University of Technology Petronas, Malaysia, E-mail: love.duah@gmail.com
Received: November 26, 2018 Accepted: December 10, 2018 Published: December 17, 2018
Citation: Evelyn Love FD, Padmanabhan E, Over DJ, Gamez Vintaned JA. Variants of Specific Surfaces in the Bakoven Member: Union Springs Formation of the Marcellus Subgroup in Central New York State (USA). Int J Petrochem Res. 2018; 2(3): 230-235. doi: 10.18689/ijpr-1000140
Copyright: © 2018 The Author(s). This work is licensed under a Creative Commons Attribution 4.0 International License, which permits unrestricted use, distribution, and reproduction in any medium, provided the original work is properly cited.
Abstract
The variants of specific surfaces of 40 samples from the Bakoven Member of the Union Springs formation have been studied using physicochemical methods.
Variations in the specific surface areas were attributed to differences in the quantities of clay minerals as well as organic matter content and types. The 2:1 clay minerals like illite and smectite were the main contributors of specific surface areas due to their large intracrystalline surfaces. Low external surface areas reported in some samples might be due to either the competition of adsorptive sites for nitrogen molecules with organic matter or the organic matter blocking of some adsorptive sites and micropores on the sample surface. The opposite is true for most of the samples that reported high TOC values suggesting that organic matter might have provided additional sorption sites for the polar compound but further study is needed to clarify. An excellent positive relationship between surface area and total organic carbon suggested that most organic matter in the samples are adsorbed.
Keywords: Clays; Organic matter; Specific Surface Area; Micropores
Introduction
Specific surface area (SSA) (expressed in squared meters/gram (m2/g).) is used in literature to refer to the area per unit mass of sample [1, 2]. It is known to greatly influence various chemical and physical properties of rocks. Physisorption, heat loss or gain resulting from such adsorption, swelling and shrinking are closely related to SSA [3, 4]. It has been shown that SSA correlates remarkably with important properties such as exchangeable cations/anions and water retention. For instance, Na-saturated clay fractions from a sample have surface area values that are 40% lesser than the same fraction when Ca- saturated. Aside cation exchange capacity (CEC), SSA may be the dominant factor in controlling the fundamental behaviors of shales [5]. The specific surface area in shale differs remarkably as a result of differences in texture, mineralogy, particle size distribution and organic matter (OM) content [3, 6]. This implies that not every part of the surface of a sample contributes to important geological processes such as adsorption and ion exchange. Fine-grained particles particularly the layered silicates are the main contributors of the inorganic surface areas in rocks [2]. Nonexpanding clays like kaolinites and some micas have only external surfaces ranging from 10-70m2/g [7] while phyllosilicates like smectite have large internal as well as external surfaces giving SSA up to 810m2/g, depending upon the amount of internal surface exposed by expansion. Consequently, the types of clay minerals in a shale largely determine their SSA and related properties.
Clay minerals contribute the greatest amount to surface area of mineral constituents of a sample, but are likely to also differ greatly deal in SSA. Clay mineral constituents are thus the determining factor in SSA on rock properties because of their platy habit and because some clays have large intracrystalline surface areas (ISA) [8-10].
SSA can be considered an intrinsic property controlled by grain size distribution and clay mineralogy [2]. It is a constant related to sample constituents and does not vary by external properties such as water content, time and location [11]. SSA helps determine the accessibility of the internal surfaces of clay mineral-complexes to molecules or ions which can be adsorbed [3].
SSA is known as the single most contributing factor for gas adsorption in unconventional systems (e.g., shale gas). For example, numerous studies have shown a positive correlation between SSA and OM [2, 5, 12]. As petroleum and/or gas are sourced from OM, the erudition of the factors that play significant roles in their preservation is indispensable to the industry. This study is therefore aimed at investigating the variations of specific surfaces as a function of mineralogy, organic carbon richness and aromaticity in the Bakoven Member of the Union Springs Formation.
Study Area
Location
The Marcellus Subgroup is located in the Appalachian basin across six states including Pennsylvania, New York, West Virginia, Maryland, and Ohio (Figure 1). It covers a total area of approximately 100, 000 square miles and the depth at which its bottom is located ranges from of 1200 to 2600 meters with an average thickness of about 20 to 80 meters. The shale contains largely untapped natural gas reserves, and its propinquity to the high-demand markets in the United States making it an attractive target for energy development and export [13].
Tectonics
The Paleozoic history of the Appalachian basin consists of three orogenic events induced by collisions between the North American plates (Laurentia) and the eastern oceanic crust, converting the region from a passive margin during the Ordovician to a foreland basin and a narrow seaway [14]. At various times, the basin was the site of restricted circulation and accumulation of organic-rich units (e.g., Utica-Point Pleasant and Marcellus subgroup). The Acadian Orogeny, beginning in the Middle Devonian, resulted in subsidence near the Acadian mountains and uplift on the opposite side caused by flexural deformation [15].
During the Middle and Late Devonian, the Appalachian foreland basin was bounded by the developing Acadian mountains on the east and south, the Cincinnati arch on the west, and the Old Red Sandstone continent to the north, and it was connected to the Rheic Ocean by a long and narrow seaway in the southwest, forming a nearly enclosed epicontinental sea [16, 17]. Tectonic loading stemming from this event coupled with eustatic sea level rise terminated shallow-shelf carbonate deposition during the Devonian and led to the accumulation of several organic-rich shale units, including the Marcellus subgroup.
Stratigraphy
The Union Springs Formation comprises all strata between the upper Onondaga Limestone and the base of the HurleyCherry Valley Limestone in Western New York [18].
The lower contact between the Upper Onondaga Limestone and the Union Springs Formation has been defined as a regional unconformity in the eastern sector of the Appalachian basin and amalgamated with the Walbridge unconformity in the northeastern portion of it, but it is conformable in New York [19]. The Union Springs Formation comprises of two laterally gradational units: the Bakoven Member in the west and the Stony Hollow Member [20] in the east of New York State. Although the Bakoven Member used to be restricted to the black fissile shale in the east, it now embodies all the entire black shale facies of the Union Springs Formation including those in central and western New York. The Stony Hollow Member is composed of calcareous shale and fine sandstone facies that underlie the Hurley Member of the Oatka Creek Formation. The type locality is in Union Springs, Cayuga County, NY in Woodʼs Quarry (Figure 1).

Materials and Methods
Materials
Powders of forty (40) samples; labeled SM01 to SM20 and then SQ01 to SQ20 from the Bakoven Member of the Union Springs Formation at Firehouse Creek-Marcellus Township and Seneca stone quarry (New York State) respectively have been used for the study presented here.
Mineralogical Analysis
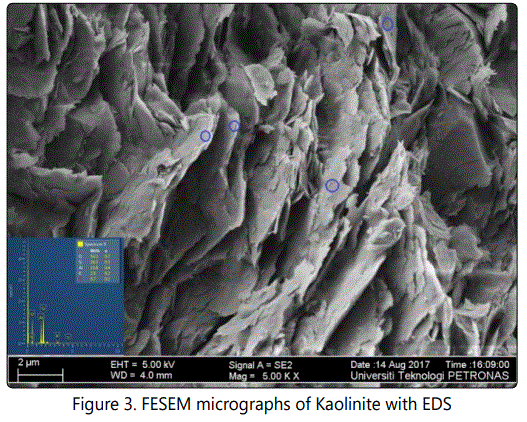
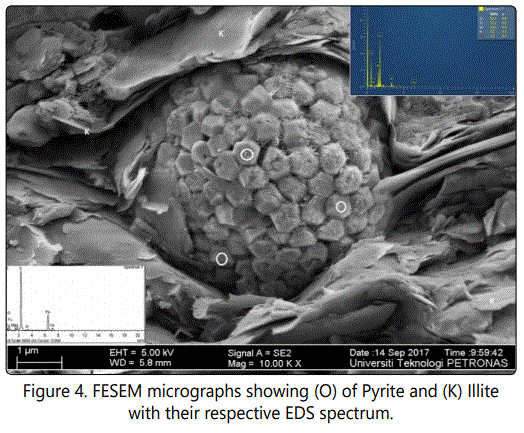
Mineralogical compositions were derived from X-ray diffraction (XRD) patterns measured on randomly oriented powders. Analyses were performed on the fine fraction (< 20µm) from representative shale samples of uniform crystallite sizes achieved through milling with a Fristch-Pulveristte 2 mill and subsequent clay separation using procedures detailed by Conptom and Allison [22], Suryanarayana and Norton [23] and Klug and Alexander [24]. Diffractograms were recorded in the 2θ in the range of 3°- 60° with a scan speed of 1°20/mm. All reported mineral compositions relate to the crystalline content of the analyzed samples [25, 26]. Mineral morphologies were determined and confirmed by the use of Field Emission Scanning Electron Microscopy (FESEM) and Electron Diffraction Spectroscopy (EDS).
Specific Surface Areas
External Surface Area (XSA) of sample particles were determined by single point nitrogen adsorption [27] using a Micromeritics ASAP 2020 instrument. The samples were outgassed for 24 hours at 80oC prior to measurements. Total Surface Areas (TSA) were determined by the ethylene glycol monoethyl ether (EGME) method described by [3, 12, 28]. The differences between TSA and XSA were recorded as the Internal Surface Area (ISA) [2].
Total Organic Carbon (TOC) Analysis
TOC was determined on powdered samples with a Multiwinanalyticjena (Multi N/C 3100) TOC/TNb analyzer adopting the direct method proposed by Dow and Pearson [29]. About 60 mg of pulverized whole rock sample pretreated with 0.1M hydrochloric acid to remove inorganic carbon (carbonates) was used for the analysis. The residual materials were used for the determination of TOC by combustion analysis of temperatures in excess of 850 °C. The evolved gas (CO) was measured quantitatively and simultaneously by infrared detectors and recorded as the percentage of carbon. TOC is reported on a dry weight basis [29].
Ultraviolet-visible (UV-VIS) Spectroscopy
UV-vis spectroscopy was performed on dichloromethane extracted hydrocarbon using a Shimadzu UV-3150 spectrophotometer adopting procedures described in Schnitzer and Neyroud [30], Stevenson [31], and then Ramli and Padmanabhan [32]. The primary interest for this analysis was to determine the ratios of aromatic (E4) to aliphatic (E6) hydrocarbon components at the wavelengths of 465 nm and 665 nm respectively.
Fourier Transform Infrared Spectroscopy (FTIR)
FTIR was achieved on an Agilent Technologies Cary 660 Series FTIR Spectrometer. Samples of 2 mg and 0.5 mg were dispersed in PIKE MIRACLE diamond attenuated total reflectance spectroscopy (ATR) to record optimal spectra in the regions of 4000 cm-1 to 500 cm-1 with a resolution of 4 cm-1 and 64 scans. Spectral manipulation such as baseline adjustment and smoothing was performed using a Spectrocalc software package (Galactic Industries Corporation, NH, USA). Interested functional groups identified in results are based on standards in [33] and [34] shown in (Figures 3 and 4).
Results and Discussion
Marcellus: Firehouse Creek
The bulk mineralogical composition of samples from this locality are fairly homogenous with quartz, illite, pyrite and kaolinite as the commonest minerals. Slight differences are the presence of calcite, dolomite,and aragonite in a couple of samples (Figure 2).
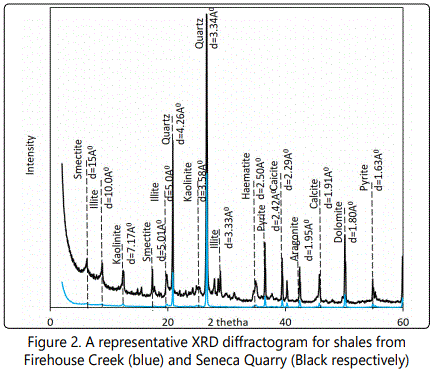
Figure 2. A representative XRD diffractogram for shales from Firehouse Creek (blue) and Seneca Quarry (Black respectively)
EGME analysis (Table 1) reported TSA within the ranges of 6.29 to 90.01 m2/g.The highest TSAof 90.01m2/g was recorded in sample SM01. XSA ranged from 1.32 m2/g to 29.89 m2/g while ISA reported were from 4.98m2/g to 64.62 m2/g. The lowest XSA and ISA were reported in sample SM16 whilst the highest values of these two parameters were recorded in samples SM03 and SM04 respectively.
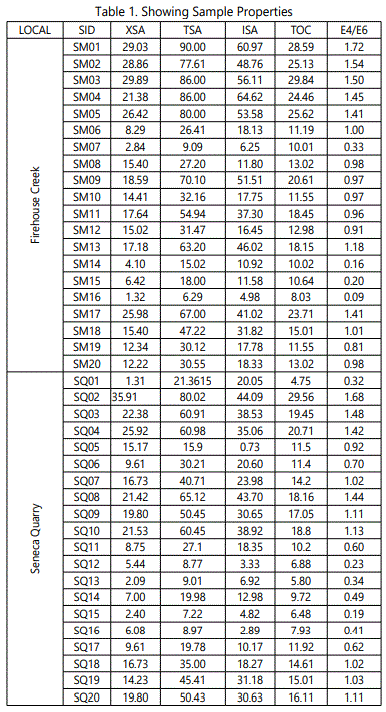
TOC values range between 8.03 to 29.84 %. Sample SM16 and SM03 reported the least and highest TOC values respectively. An average of 16.14m2/g, 47.42m2/g, 31.28 and 17.08% was recorded for XSA, TSA, ISA,and TOC respectively. The aromaticity (E4/E6) values in the samples from this locality range from 0.09 to 1.72. About 45% of the studied samples were aromatic (i.e. E4:E6>1). All the remaining 55% were dominated by aliphatic compounds. An average of 0.98 E4:E6 was assigned to the samples.
Seneca Stone Quarry
The clay mineralogy of shale from the Seneca Stone Quarry is similar to the samples from the firehouse creek (Figure 2).
TSA values range from 7.22m2/g to 80.02m2/g. SQ02 reported the highest TSA values. The range of values recorded for XSA and ISA are 1.31m2/g to 35.91m2/g and 0.74m2/g to 44.09m2/g respectively for samples SQ01 to SQ20. The least recorded ISA and XSA values were from samples SQ05 and SQ01 respectively.
TOC values from the Seneca Stone Quarry samples range from 4.75% to 29.56% with an average of 13.51%. SQ02 reported the highest value and SQ01 the least. E4:E6 values at this site range from 0.19 to 1.68. About 50% of the samples were dominated by aliphatic hydrocarbons (i.e. E4/E6<1).
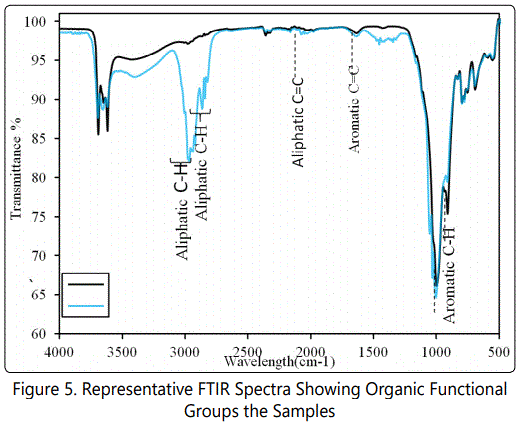
The presence of aromatic organic hydrocarbons in most of the studied shales is supported by the aromatic C=C stretching and Aryl-H (C-H bending) functional groups at wavelengths of 1600 cm-1 and 900 cm-1 respectively indicated in the representative FTIR spectrum (Figure 5). The highintensity methyl functional groups (CH3) at wavelengths of 2960 cm-1 and 2850 cm-1 are supporting evidence of the dominance of aliphatic organic carbons in the samples. These are presented in the representative FTIR spectrum for the aliphatic dominated shales (blue curve in Figure 5). Despite the similarities between the hydrocarbons functional groups recorded in the shale, great variations exist between the peak intensities. These variations may account for the differences the aromaticity recorded.
Interpretation
Variations in the SSA within the Bakoven Member may be accounted for by variations in clay mineralogy as well as OM type and content that make up the samples. The relatively high TSA and associated ISA values reported in most of the samples may be due to the presence of the 2:1 clay minerals like illite and smectites. These clay types have relatively large intracrystalline surface areas of about 750m2/g [7] as such their presence in these samples explain the high reported TSA cum ISA values. Although higher values of ISA than these were expected.- Those recorded herein might have provided additional adsorptive sites (or micropore volume) increasing the samples EGME retention capacities [5] (Table 1). It is also likely the presence of other molecules compete for adsorption sites with the EGME molecules, presumably kaolinites and/or OM. This is because the accessibility of ISA to polar molecules according to Carter, et al. [3] is generally dependent on the relative adsorption forces of the introduced EGME molecules or ions to the clay mineral surfaces as compared to the attraction forces between adjacent clay molecules.
Apart from mineralogy, variations in TOC may explain the variations in XSA, TSA and ISA recorded. The dominance of TOC accounted for the relatively high surface areas reported in the samples due to their provision of an excess site for molecule adsorption, others suggest that it is rather a relatively large specific surface that protects organic matter from microbial degradation [35-37]. Either way, these schools of thought suggest a close relationship between the dominance of organic matter and the creation of adsorptive site. Such relationship between TOC and surface area may throw more light on the relatively low XSA, TSA and ISA recorded in samples SM07, SM16, SQ15 and SQ16.
The relationship between SSA and TOC
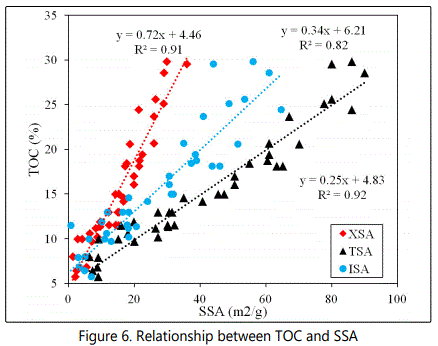
The excellent positive correlations (R2 = 0.91, 0.92 and 0.82) between SSA (m2/g) (XSA, TSA, ISA) and TOC (%) distribution (Figure 6) was as expected and may suggest that the OM is bound to the inorganic surfaces; possibly the clays in the form of a monolayer coating the entire grain surfaces [5, 12, 35, 38, 39] although Trask and Hammar [40] postulated that the two may be associated due to their hydrodynamic equivalence. The relatively lower positive correlation (R2=0.82) between TOC and ISA indicates that XSA of the samples are the main provider of additional adsorption capacity to OM for the samples.
Organic matter has been shown to increase SSA by providing additional sorptive sites in organic-rich shales through various mechanisms. For example, exchangeable cations in clay minerals may be replaced by anionic organic functional groups through interactions with the aluminol groups at relatively low pH (below the ZPC, when these functional groups carry a net positive charge [41]. Organic matter may also be adsorbed onto hydroxyl groups and electronegative atoms of adsorbing molecules through weak hydrogen bonds [42] or may intercalate between the intracrystalline layers of expansive clays through pathways such as cation exchange and/or dipole-dipole attractions where organic matter replaces interlayer water molecules [43]. They may also be simply associated with fine-grained sediments due to their hydrodynamic equivalence [40]. The adsorption of organic matter onto inorganic clay mineral surfaces indicated by the positive correlations confirms that clay minerals in the study areas protect organic matter from microbial activities and remineralization.
The relationship between SSA and Aromaticity
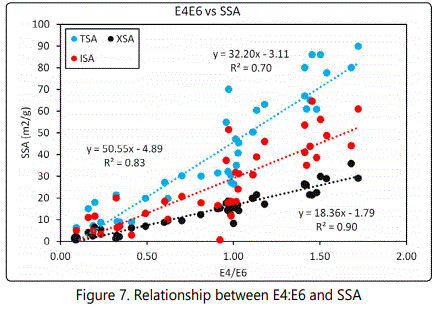
Measured values of E4/E6 show a positive correlation (R2=.0.83, 0.70, 0.90) between the E4E6 hydrocarbon carbons (E4/E6<1) and SSA (TSA, ISA and XSA Figure 7). The positive correlation between E4/E6>1 and TSA/XSA/ISA in most of the aromatic dominated shales may suggest the significance of the complexity of organic chemical structure, in particular, aromaticity in the SSA of the formation under investigation. These resultsare consistent with the works of [9, 44]. Aromaticity of organic carbon has been shown to be relatively proportional to maturity [45, 46] which is also indirectly proportional to micropore volume [5] and subsequently to SSA. Aromatic hydrocarbons provide additional adsorptive sites increasing the specific surface areas of the respective shales. The details of the mechanisms for this in the shales in question, however, is not fully understood [44].
Conclusion
The study of the specific surfaces of shale samples from the Bakoven Member of the Union Spring Formation has shown that total, internal and external surface areas range from 6.29 to 90.01 m2/g, 0.74 to 64.62 m2/g and 1.31 m2/g to 35.91 m2/g respectively. The primary variants of specific surfaces were organic matter content, aromaticity and clay mineralogy. All three parameters of SSA (i.e. TSA, ISA and XSA) follow linear trends with TOC although significant deviations from this trend are observed for individual samples. The complexities of the hydrocarbons also influence SSA positively though the mechanisms of their occurrence is poorly understood and thus requires further studies. The influence of mineralogy on SSA was ascribed to their clay contents. Although their exact influence may be known after quantitative clay mineralogical analysis.
References