Case Study
A Rock Physics based Petroleum Reservoir Characterization. The Case of a West African Reservoir
Department of Mineral and Petroleum Resources Engineering, Kaduna Polyechnic, Nigeria
*Corresponding author: Mukhtar Habib, Department of Mineral and Petroleum Resources Engineering, Kaduna Polyechnic, Nigeria, E-mail: mukhtarhabib102@gmail.com
Received: September 28, 2018 Accepted: November 29, 2018 Published: December 4, 2018
Citation: Habib M, Bida AD, Bello A. A Rock Physics based Petroleum Reservoir Characterization. The Case of a West African Reservoir. Int J Petrochem Res. 2018; 2(3): 207-211. doi: 10.18689/ijpr-1000137
Copyright: © 2018 The Author(s). This work is licensed under a Creative Commons Attribution 4.0 International License, which permits unrestricted use, distribution, and reproduction in any medium, provided the original work is properly cited.
Abstract
The primary variables that determine the elastic response in clastic sediments are porosity, minerology and pore fluid. However typically, only two are obtained from seismic data. As a result, resolving petroleum and gas reservoir properties in respect of seismic data is not obtainable. In order to resolve this problem a case study is presented here. The study is based on well log data derived from the West African Congo basin. A marine environment characterized by thick shale above a shaly/sand oil layer with elastic properties linked to sediment properties by the rock-physics model of Han et al. (1986). Taking into consideration the work of Thomas and Stieber (1975), a petrophysical linear link was developed based on conceptual inferences. This link is expected to serve as a means of substituting porosity for clay content and vice versa in order to resolve the underdetermined system of rock-physics equations. As a result, an inversion of reservoir elastic properties for petrophysical properties becomes obtainable. Furthermore, this work presents reservoir delineation based on Han et al (1986) model on the well log scale and later up scaled to the seismic scale.
Keywords: Han et al. (1986); Porosity; Clay content; Reservoir
Introduction
Making best management decisions in any oil and gas field development program is no doubt a function of a clearly defined and qualitative reservoir characterization. It is a common knowledge that the decision to go ahead with any such project is based on economically viable pay zone. The importance of a coherent static model in the overall reliability of reservoir management has been constantly emphasized. Several authorʼs [1-6], have established that the static characterization of reservoirs both in terms of geometry and petrophysical properties are key factors for reservoir performance. It is worth stating here that in many cases static model is been matched with reservoir performance history in a move to measure the accuracy of the geologic models. Therefore, the result of reservoir characterization defines whether to continue with well completion or not. This important decision is made at the middle of financial investment during the project. The decision is even more critical when one is dealing with several wells or an entire field.
Petrophysical analysis forms a bedrock of reservoir characterization in which data such as well logs, special core analysis (SCAL), mud logging and other sources are analyzed and interpreted for the purpose of establishing models that could effectively represent lithology, clay content (C), porosity (ϕ), Saturation (Sw), permeability (K), production rate and economic evaluation that are targeted on a zone of interest [7-9]. Rock physics on the other hand, makes use of petrophysical data and other core observations data in order to provide alternative elastic properties of the same formation under study. These properties are of great importance for an improved reservoir characterization and modeling, because it deals with the theoretical and experimental study of the physical properties of rocks, their relationships, and their expression in geophysical and petrophysical data. Rock Physics is currently playing an important role in optimizing reservoir performance as well as management, due to its ability to give explicit information when compared to petrophysical analysis result, thereby giving strategic advantage for evaluating rock properties and there changes under reservoir conditions from insitu measured data. Furthermore, it establishes a relationship between material properties and seismic response so that properties can be observed seismically, and its key advantage is its ability to translate basic rock properties into elastic properties (forward modeling) and otherwise (inversion/backward modeling), for the purpose of exploration, exploitation and management of petroleum and gas reservoirs.
Rock physics have a variety of models in application as presented in some publications [10,11]. As a category model, empirical models are built on some basic assumptions which are applied to determine some co-efficients by calibrating a regression data. Some of the best known models are Hanʼs regression [12] for Velocity (V), C and ϕ in sand stone reservoirs, the [13] for Vp -Density (ρ) relations and the [14] for Vp /Vs relations.
Various reservoir prediction models have been proposed by several authors, the common forward models utilized are on the basis of statistical analysis which work better when computing elastic properties if φ and C are known [12,15-16]. For this category of models, a noteworthy match between [12] model and the data utilized for this study was observed during the rock physics diagnostic [12] et al. derived some equations that provide a significant contribution in finding other possible reasons for velocity reduction. The equations were derived by means of statistical methods using 75 different brine saturated sandstone samples with porosity ranging from 3 to 30% and clay volume ranging from 0 to 55%. These equations, which relate velocities (P and S waves) to total porosity and clay content, revealed that sonic velocity, get reduced with an increase in the amount of clay volume. Another contribution is the possibility of obtaining elastic properties when the values of porosity, clay content and confining pressure are known. Inversely, clay content can be obtained if P wave velocity, porosity and confining pressure are known.
Seismic inversion has been playing an important role in mapping elastic properties, such as the Poissonʼs ratio (ν), P-wave impedance (Ip), and density (ρ), in the subsurface. The target is always toward evaluating reservoir petrophysical properties such as porosity (φ), clay content (C), and pore fluid (Sw). The conversion of these elastic properties into petrophysical properties requires a rock physics model that links Ip and ν to φ, C, and Sw. However, even if a perfect rock physics model is available, we cannot resolve two equations for three unknowns. The problem is that no more than two elastic properties can be obtained from seismic data.
In this paper, we (1) established a petrophysical linear relationship between porosity and clay content based on the [12] empirical relation thereby enabling a substitution between porosity and clay content (2) Conducted reservoir delineation on the basis of data derived from Hanʼs model as a move to optimize petroleum reservoir characterization through rock physics approach.
Methodology
Two reservoir petrophysical properties (ϕ and C) and two reservoir elastic properties; acoustic impedance (Ip) and poisson ratio (ν) were the primary parameters considered herein, because understanding of ϕ and C is required for a shaly sand reservoir. The workflow starts from (1) well log quality control (QC) and conditioning to ensure that the required data were available and physically reasonable in support of Petrophysics and Rock physics activities; (2) Petrophysical analysis was conducted in order to generate important log curves, such as ϕ, C, ρ and resistivity of the study interval, this enables definition of facies intervals with respect to depth; (3) Based on conditioned well logs (measured Vp , Vs and ρ), Rock physics (elastic) properties such as Ip and ν were computed and fluid substitution was performed through [17] equations so as to bring all data to 100% brine. Then a rock physics diagnostics was performed by cross-plotting Ip and ν versus ϕ. The idea here was to select a model that match the well log data. A model based clay content was generated from the selected [12] model (4) Reservoir rock portion was delineated on the bases of Ip and ν crossplot color coded by porosity log derived from the [12] model (5) A petrophysical linear link between Porosity ϕ and model based C was established.
Result: Case Study Application (Well Log and Seismic)
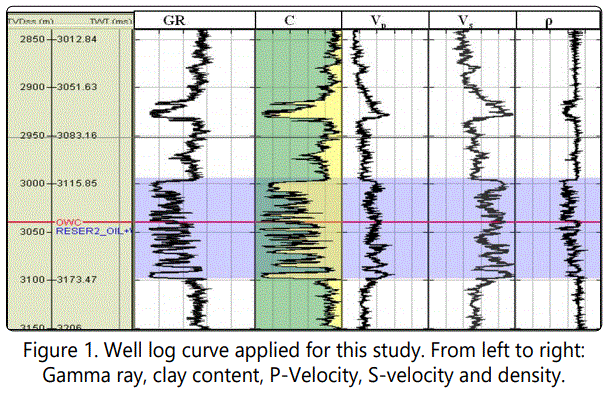
This study is based on well log data derived from the West African Congo basin. A marine environment characterized by thick shale above a shaly/sand oil layer. The Miocene target reservoir is a series of turbidite sediments deposited on a broader valley, its upper part consists of homogeneous sandy deposits (figure 1 in interval 2912~2931m), followed by prograding shaly deposits. The lower part is the turbidite deposit composed of sandy deposits with intercalated shaley layers figure 1 in interval 2997~3098 m).
Step 1: Data gathering, quality check, editing and conditioning
Here, initial well data (density, compressional and shear velocities logs, etc.) with spurious values were corrected by the help of rock physics modeling.
Step 2: Petrophysical analysis
Porosities of the reservoir sands range from 15% to 30% and get reduced with an increased amount of clay content, thereby causing a velocity reduction (Figure 1). This observation was an important clue by assuming that the only minerals within the study area are quartz and clay.
A lithology indicator (GR log) was utilized to derive shale volume and clay content. This is done by linearly scaling GR in order to put forward a maximum and minimum C that corresponds to the GR, in which a C value of 0.07 for minimum GR (pure sand) and 0.93 for maximum GR (pure shale) were assumed. Total porosity log is not neutral in the proposed methodology since it must be computed from density log, according to Equation (1). The equation is based on the assumption that density of the mineral phase is fixed as 2.65 g/cm3 while bulk density is based on brine saturated conditions.


where ρb is the bulk density, ρw is the density of brine given in Table 1. ρs and ρf are densities of mineral and fluid phase respectively.
Step 3: Rock physics diagnostics and modeling
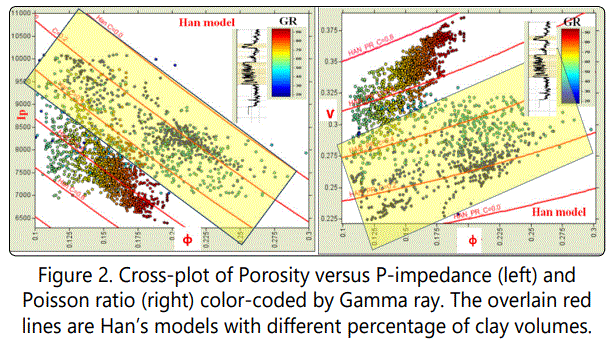
This step comprise of rock physics diagnostics which consist of trying several rock physics models in order to determine the one that best fit the data. Since majority of rock physics models were derived from brine saturated rocks, the actual original oil bearing reservoir were replaced by 100% brine through Gassmann equations [12]. Model curves for Ip and ν have been calculated for different values of C, which was found to match the data as depicted in figure 2 (left and right). On Ip or ν versus total porosity crossplot overlain by Hanʼs model at different values of C, there is a noteworthy correspondence between Hanʼs model and the data (Figure 2). It is therefore clear that both ϕ and C significantly affected Ip . It can also be seen from figure 2 (left), that at a constant C, Ip increases with a decrease in ϕ. Conversely, at a constant ϕ, C decreases with an increase in Ip . This dependence property of Vp and Ip on C was carefully presented by [12,16]. In figure 2 (right), value of ν calculated at 100% water saturation was presented, so as to serve the purpose of understanding the dependence of ν on ϕ and C and/or lithology. It can be seen that both ϕ and C significantly affect ν, it can also be observed that at a constant C, an increase in ν corresponds to an increase in ϕ, while at a constant ϕ a large value of C also represents a large value of ν. The dependence of ν on ϕ is always clear in sand and shaly formations. It is apparent that this dependence is strongly linked to lithology because ϕ and lithology vary together. The yellow rectangle on figure 2 depicts the limits of the target reservoir which is also colored in yellow on the GR curve shown in the (Figure 2). A close look of this figure reveals a C range of 0 to 0.55 for reservoir sand and that of the overburden shale at 0 .45 to 0.95.
Hanʼs model was selected for this study because the model was derived from empirical data for brine saturated consolidated sediments. While the diagnostics conducted above reveal that the model matches the data from our study area, meaning that it is consistent with the geological background of the study interval. This makes the model predictive beyond the data set used for matching. Hanʼs model is a strong tool and a simple means of manIpulating porosity and lithology as well as elastic wave velocity. The models were generated from a huge set of well log and core data, which provides relative degree of certainty that the models are efficient and can be utilized on other sets of data whose original backgrounds are analogous. Other simple empirical equations applicable for similar case are that of [18,19]. But due to the fact that Hanʼs model suitably describes and explains our data, it has been decided to apply it for getting the model based clay content.
Considering a confining pressure of 20MPa, with velocities in km/s and sandstone samples are water charged, Hanʼs equations applied herein are written as follows,


Where Vp and Vs are compressional and shear wave velocities respectively.
Ip and ν as functions of Vp , Vs and ρb are expressed in Equations. 3,4,5 and 6 as follows;


The idea is to get a model based C from initial Vp and Vs logs by applying the model-based approach. Hence, any of Equations 3 or 4 can be applied.
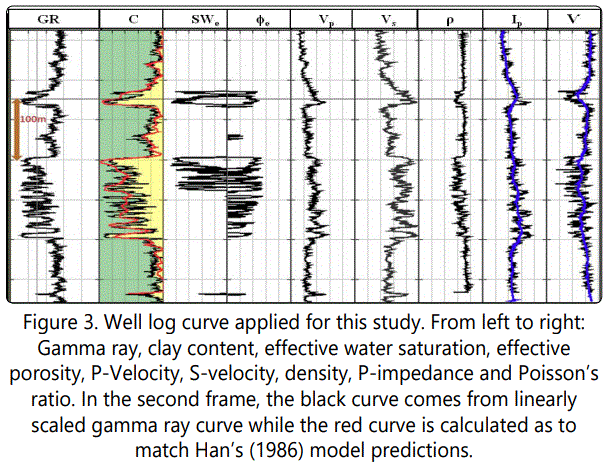
The comparison between C derived from linearly scaled GR log (black) with the model-based C curve (red) is depicted in Figure 3 (second panel), in which a similar trend is observed between the two. Meanwhile, the model-based C is used in the remaining part of this research.
The model based clay content (C) was preferred over the clay content derived from linearly scaled gamma ray. The choice of model based C is explained by the fact that it is linked to elastic properties (Vp and Vs) through rock physics model of [12].
It is important to mention that during this step, several rock physics models were tested [12]. Models was found to better describe and explain the real data. Indeed, except some points, all the points representing the data fall nearly within the boundaries imposed by Hanʼs model. In addition, it is clear that P-wave impedance gets reduced with an increase in the amount of clay volume, while the ν decreases with a decreasing amount of clay volumes. This observation was also made by [12].
Step 4: Petrophysical link between ϕ and C
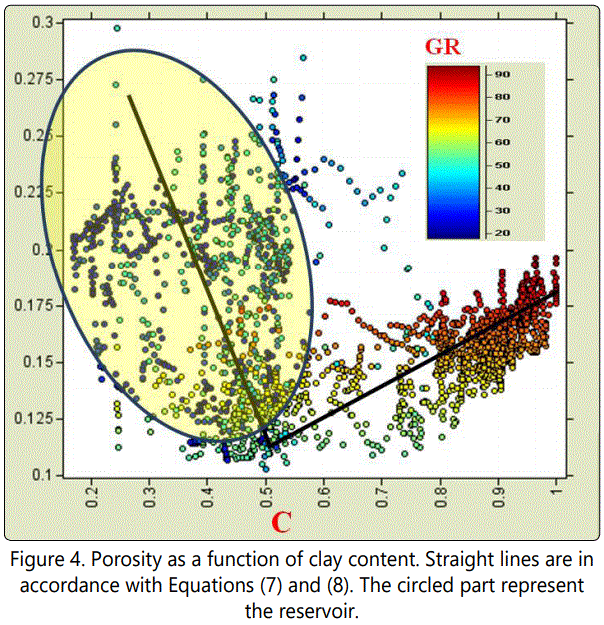
The concept proposed by [20] was applied here in order to establish the desired link. (Figure 4) shows the cross-plot of ϕ versus the model based C in which it can be observed that ϕ is relatively large but experiences a decrease as the value of C increases in the clean sand. This trend shows a turning point at C = 0.5, where the transition from sand to shale occurs thereby making a V-shaped pattern. This V-shape pattern is a characteristic of a bimodal sand/shaly mixture [15,21].
Following the works of, the relationship between Porosity and model based clay content was established using two linear equations.
From the actual ϕ-C cross plot, the trend within the sand reservoir is not well defined, while in the shale zone, the trend is quite clear. This observation revealed that for a shaly sand reservoir zone, several trends are possible. As a result, several trends in terms of linear equations can be tested in the shaly sand zone during ϕ-C any possible inversion. Therefore, through substitution method, Equations 7and 8, can be applied to optimize result and will no doubt be applicable in inverting ϕ and C from Ip on log scale and on seismic scale as well.


Step 5: Reservoir delineation by combining ν and Ip
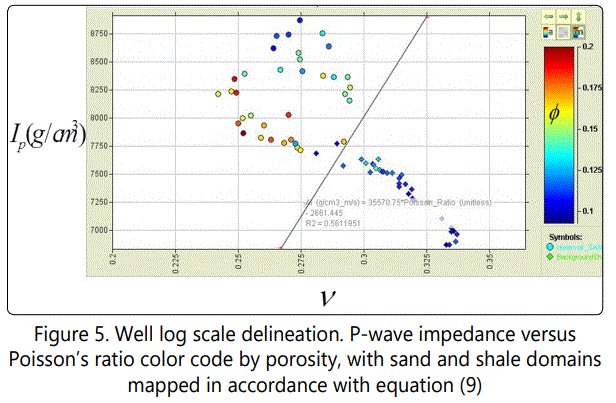
Second contribution of this work is presented in this section. The essence of this step is to make reservoir delineation based of the rock physics diagnostics provided by [12] in step 3 above. This is to isolate the reservoir from the non-reservoir intervals by mapping two different domains (shale and sand). As presented by figure 2, the shale domain is having a C range of 0.45-0.95 which corresponds to a ϕ range of 0.1 – 0.125 (Figure 5). Similarly, for the sand domain, a C range of 0.0 - 0.55 and a ϕ range of 0.125 - 0.22 was mapped. The pay sand and shale zones do not overlap, which means that the sand can be traced by seismic data through combining Ip and ν. In order to make a clear demarcation, a cut offline that would separate the shale zone from that of the sand was developed as shown in (Figure 5). Eventually, Equation 9 was applied in respect of demarcation.

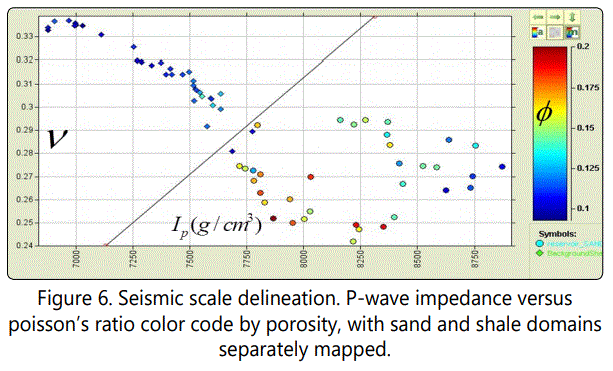
If Ip<3550.75ν-2661.45, the zone is considered as sand and if Ip≥3550.75ν-2661.45, the zone is considered a shale zone. This Cut-off value is apparently valid with log data. Is this cutoff value going to be the same on a seismic scale? To answer this question, a cross plot of an upscaled Ip and ν logs was carried out, in which similar trend with the well log scale model is observable. This has shown that the chosen cut off value is valid for reservoir delineation (Figure 6).
Reservoir delineated at the seismic scale, is slightly different from the actual one derived at the well log scale. This is because the up-scaled poison ratio curve has larger lower end values compared with the well log scale curve. This is a typical up-scaling artifact when converting to seismic from well log, therefore such a consideration has to be made while interpreting results.
It is therefore established that pay reservoir intervals can be detected from seismic data using a combination of seismically derived Ip and ν, as a result, quantification of porosity and C in the sand can be attempted. For this purpose, an additional link between porosity and C is required.
Conclusion
With respect to rock physics modeling of reservoir properties, Han et al. (1986) model was found to fits the data utilized herein. Hanʼs model was used to estimate the clay content which was referred to as model based Clay content. This work also realized that model based clay content gives better results than a linear GR based clay content when computing model based acoustic impedance.
It is also presented herein that clay content derived from Han et al (1986) model gives a linear relationship with porosity thereby becoming a basis for resolving the problem of underdetermine system of rock physics equation when converting elastic properties to petrophysical properties in a shaly sand environment.
References