

Research Article
Testing and Prediction of Flare Emissions Created during Transient Flare Ignition
1Chemical and Biochemical Engineering Department, Missouri University of Science and Technology, Rolla, MO, 65409, USA
2Elevated Analytics, Inc., Tulsa, OK, 74015, USA
*Corresponding author: Joseph D. Smith, Chemical and Biochemical Engineering Department, Missouri University of Science and Technology, Rolla, MO, 65409, USA, E-mail: smithjose@mst.edu
Received: May 2, 2018 Accepted: August 23, 2018 Published: August 28, 2018
Citation: Smith JD, Al-Hameedi HA, Jackson R, Suo-Antilla A. Testing and Prediction of Flare Emissions Created during Transient Flare Ignition. Int J Petrochem Res. 2018; 2(2): 175-181. doi: 10.18689/ijpr-1000131
Copyright: © 2018 The Author(s). This work is licensed under a Creative Commons Attribution 4.0 International License, which permits unrestricted use, distribution, and reproduction in any medium, provided the original work is properly cited.
Abstract
Computational fluid dynamics (CFD) was used to simulate multi tip flare system with different operating conditions during ignition time. Single tip and three tips flare systems were simulated and verified against experimental test to get CFD combustion model that required for multi tip flare system. Natural gas, propane, propylene, ethylene and xylene were used as flaring gases in simulated tests of single and three tips flare under an open environment that carried out at the Zeeco facility in Tulsa, OK. This study aimed to predict the soot formation and heat radiation from full multi tip flare field by using CFD modeling with verified combustion model and large eddies simulation (LES) turbulence model with a reduced four step combustion mechanism. The results showed that the multi tip flare system performance can be predicted by using C3d tool.
Keywords: CFD, Multi-Tip Flare, Radiation, Emissions, Combustion, Flare Performance, Flare Regulations
Introduction
Flares are the most important safety equipment during upset or sudden shutdown events in the chemical and petrochemical plants. They are combusting relief and unusable flammable gases in an open atmosphere to prevent tragic events in the whole system. Also, they used to prevent the atmospheric pollution with different contaminants by converting them to CO2 and water. Many steps have been taken by different countries towards reducing the amount of gas flaring around the world. However, the global trend of gas flaring is increased each year due to increasing of global oil and gas production where the estimated amount of gas flared in 2012 was 145 billion cubic meters and in 2016 was 149 billion cubic meters [1] [2]. Additionally, regulations for flaring process operation and design such EPA 40 CFR 60.18, and API 521have been established to ensure high flare performance[3] [4]. However, in the flaring process, ignition can be delayed for unlit flares or extinguished pilot flame flares and hence unburned hydrocarbons and black carbon (BC) release to the atmosphere.
During the flare ignition process, the hydrocarbon gas is fed through a stack into the atmosphere where it is ignited using an external energy source. This phenomenon is clearly seen by the incomplete combustion that occurs moments after flare ignition where BC emissions form during the flare ignition process. This transient is caused by the inefficient mixing of flare gas and air during first 10-30 seconds of flare operation. Therefore, large amount of BC release to the ambient air. On the other hand, heat is released by combustion reaction of vent gas with oxygen during flaring process.
Black carbon has a negative influence on the climate and human health. For example, when black carbon deposits on reflective object surfaces, it could darken these surfaces and cause a decrease in albedo (percentage of reflected solar radiation from the object to space), e.g. snow, ice, and white surfaces. By absorbing solar radiation, BC causes melting of snow and ice. Also, BC can influence the cloud dynamics and properties by absorption radiation from the atmosphere. Moreover, BC can affect the human health by causing respiratory illnesses, cancer, and congenital defect [5]. On the other hand, part of the heat that release from combustion reaction radiated to the surrounding facilities and objects. Therefore, flares should be far enough or have suitable distance from other objects to avoid the heat radiation effect on the workers and other equipment. Consequently, estimation of heat radiation rate from flaring practice is essential in designing task of flares.
Many studies on measuring and estimation of BC emission from flaring process have been carried out [6] [7] [8] [9] [10] [11] [12].Most of these studies reported that the BC emission is increasing with decreasing the flare combustion efficiency. McEwen J. et al. [8] measured the quantitative emission of soot in lab scale flares of 12.7-76.2 mm inner diameters with jet velocity 0.1-2.2 m/sec, four and six component methanebased fuel mixtures. They found an empirical relationship between heating value (HV, MJ/m3)of flare vent gas and the soot emission factor, SEF (kg of soot / 103 m3 fuel), as shown in equation (1).

Wang et al. [12] suggested a new reaction mechanism with 50 components to predict soot emission by predicting important soot precursor species such as C2H2, C2H4, and C6H6. They showed that CFD simulation of an air assisted flare with this mechanism better predicted soot emission from the flare.
Several investigations have been done to study the thermal radiation emissions [13] [14][15][16][17][18] from flares. Smith, et al. [16] evaluated the effect of the flaring operation of multiple flares on the neighboring flaring system fields at the maximum flow rates by using CFD technique. Smith, et al. [17] studies the effects of the flare plume from multi point ground flares on surrounding facilities and workers at the maximum flow rates using LES based CFD simulations. Recently, a new modeling approach to predict heat radiation from gas flaring has been introduced by Miller [18]. However, this model has been developed for H2 and syngas flaring.
Analytical quantification of an elevated multi-point flare (MPF) operating at full-rate is very difficult. These difficulties are due to the large size of the combined flame from multiple burner tips operating in the multi-point flare and the associated high radiation flux from a flare operating high above the ground. Due to the large plume emitted from a MTF with the associated high heat radiation, emission measurements are also very difficult to perform. The API 521 flaring guidelines includes design criteria for a flaring system but focus on utility flares and assisted flares with little consideration for MPF flares. Therefore, additional performance metrics are needed for MTF design and performance [13].
To the author's knowledge, none of these studies that mentioned above regarding soot emission estimated BC emissions from flares during the flare ignition process. Therefore, the objective of this study was to estimate the amount of BC released during the ignition time of flare system annually. Also, the thermal radiation to the surrounding, and the formed soot estimation for MTF systems have been simulated using CFD technique.
Materials and Methods
Testing
One set up for the experimental tests has been used in
this study to measure soot emission and heat radiation
emissions from single tip and three tips flare. A view of
experimental rig is shown in Figure 1. The purpose of these
experiments was to provide the required data for validation
with the CFD combustion model that is needed later for the
simulation of full multi tips flare system.
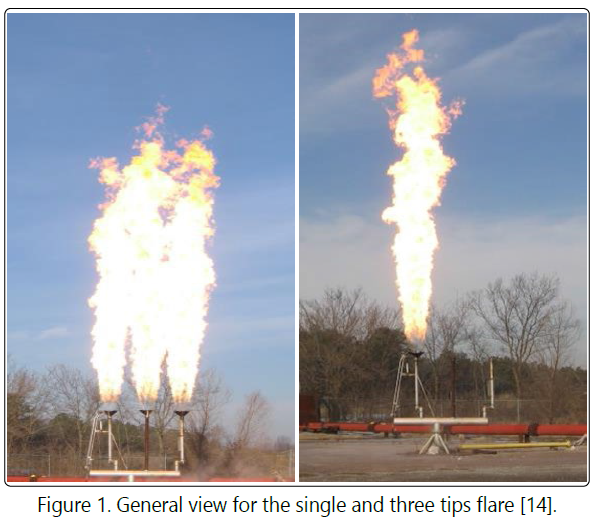
Different flare burner tips are used in flaring system such as pipe burner and multi arm burner to handle large amount of waste gases especially in the oil and gas production field. The advantages of using multi-arm burner are to improve the local turbulence and mixing of flaring gas with air. Also, these burners minimize the thermal radiation levels because of its resistance to wind deviation. They are fabricated from 310 stainless steel casting materials via investment casting to increase the operating life of the burner. To get a safe and reliable operation of these burners, they are tested against pressure in the manufacturing factory. A view of multi arm burner is shown in Figure 2. The single flare tip was consisted of main horizontal tube join to another vertical tube with one multi arm burner while three tip flare was included one main horizontal tube connected to three vertical tubes with one multi arm burner at the end of each vertical tube as shown in Figure 2.
The experimental tests were carried out at Zeeco Inc. facility in Tulsa, OK, using wide range of gases such as methane, propane, propylene ethylene and xylene. Thermal radiation measurements were performed in two different locations for the single and there tip flares; the first one lies 5 meters far from the flare tip and the second location lies 20 meters from the flare tip. Two circumstances for cross wind velocity have been considered where one of those velocities is zero. The other velocity for the cross wind was chosen to be 3 meters per hour.
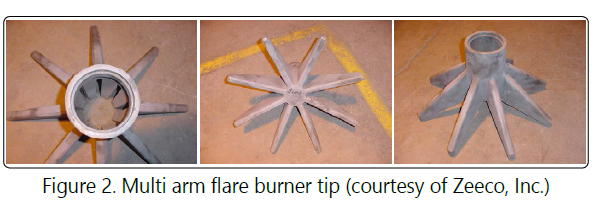
Results and Testing
The effect of the cross-wind velocity for single tip flare tip with propane as a vent gas is presented in Figure 3. When there was no wind, then the shape of the flame above the flare tip was elongated and similar to the pencil shape. As shown in Figure 3, the wind speed effects flame shape and causes the flame to be bent. Also, the wind speed reduce the flame temperture and hence the thermal radiation decreases. When the cross wind velocity 8 to 10 mile per hour (mph), the flame titled towards downside of wind with an angle of 8o and the height of flame was 10.5 meters where the height reduction around 30 percent as shown in Figure 3
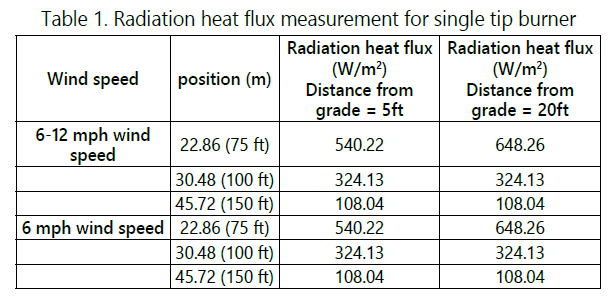
The test setup for heat radiation from single tip is displayed in Figure 4. For thermal radiation measurements a 6-12 mph wind speed blowing mostly from south to the north with an angle of 169o were implanted during single tip test with propylene fuel as shown in Figure 4. These measurements were taken in three different positions. The distances of these positions were 75 ft, 100 ft, and 150 ft far from flare flame as shown in Figure 4.
The thermal radiation from single tip burner obtained at different position and wind speed are included in Table 1.
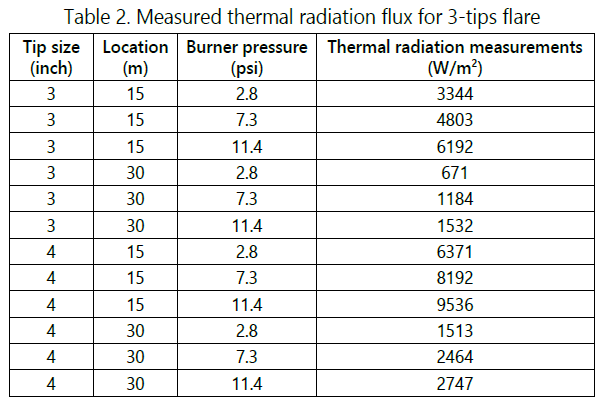
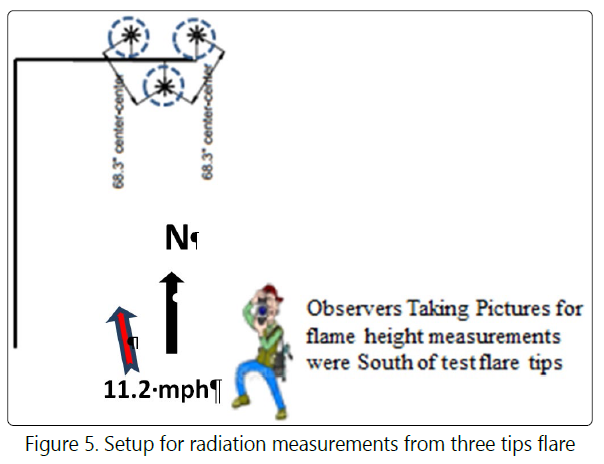
Three tip burner utilized ethylene as a flaring gas to measure heat radiation from flare flame in three different locations with wind blowing from south to the north direction. The set up for taking measurements is shown in Figure 5. Heat radiation from three tips burner flare system results for the different position and 11.2 mph for cross wind speed are summarized in Table 2.
Three varies burner pressure were implemented with two burner sizes to measure heat radiation from flare flame. These measurements were taken at two different positions, 15 m and 30 m from flare flame as shown in the test setup which depicted in Figure 5.
Reaction mechanism
Numerous reaction mechanisms have been suggested to
conduct a detailed kinetic modeling of combustion reaction
that hasability to solve the combustion chemistry and predict
concentrations of reaction components. Among these
mechanisms, Smith et al. [15] [19]suggest simplified four step
chemical reaction mechanism to approximate the flare gas
combustion.
Previous validation work has been carried out to assess the accuracy of the combustion scheme shown above which has also been incorporated into a CFD based flare model [14] applied to several gas flare systems.
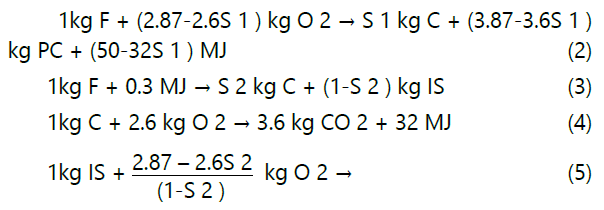
The first reaction represents hydrocarbon fuel combustion and describes the incomplete reaction of Fuel (F) with oxygen (O2) to produce Products of Combustion (PC) and black carbon (C) and some energy (MJ). This reaction produces S 1 kilograms of black carbon per kilogram of fuel consumed where S 1 depends on the fuel type (0.005 used for light hydrocarbons [20]). The second reaction represents the endothermic fuel pyrolysis or cracking reaction which produces S2 kilograms of black carbon (0.15 used for light hydrocarbons) and Intermediate Species (IS) such as carbon monoxide. The third reaction consumes black carbon and more oxygen to produce carbon dioxide (CO2) and some energy. The final reaction consumes the Intermediate Species formed in the second reaction plus some additional oxygen to form combustion products and energy.
CFD Modeling
Three computations for single tip, three tips, and multi-tip flares
were conducted using C3D software. The turbulent reaction
chemistry coupled with radiative transport between buoyancy
driven fires and surrounding objects was simulated using this tool.
Physical Parameters
For the purposes of modeling of this study, an average gas
density of 1.04 kg/m3 was assumed. Also, a standard gas pressure
and temperature of 1 atm and 293.15 K was used. Moreover, an
average molecular weight of 25 kg/ kmol for the volume flow for
each flare was considered in the available operating data.
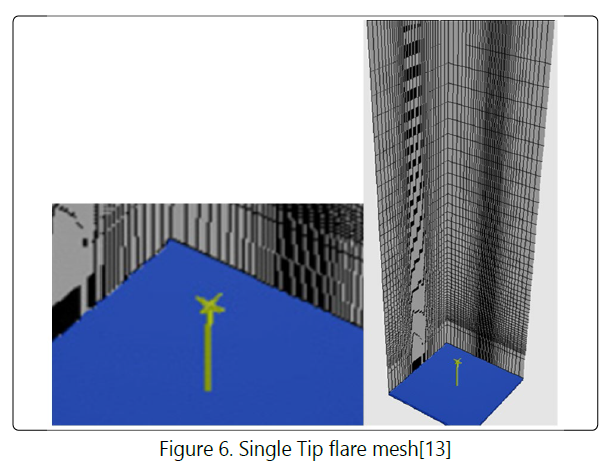
Single Tip Flare Modeling
In order to obtain the flame dynamics as flame shape and
size of single flare tip, CFD simulation cases have been performed. Also, thermal radiation and soot estimation were found using
these computations. The simulations was carried out using 3-D
physical domain with dimensions of 6 m, 6 m, and 26 m for the
length, width, and height respectively. The flare tip was located 2
m above the ground level. Rectangular cells were used to
construct the mash of physical domain where the number of
cells in this domain was 110,000 cells as shown in Figure 6.
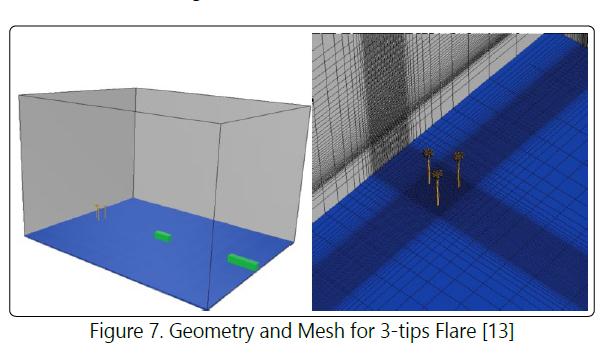
Three Tip Flare
The 3-D domain of 30, 35, 25m dimensions was used for
simulation with radiation meters (solid boxes) which distance
in 15 m and 50 m respectively from the flare burners for the
three tips flare as shown in Figure 2. The mesh was refined
locally near burner tips and radiation measuring unit. The
total number of control volumes was 188,000 of computational
cells as shown in Figure 7.
Multi Tips Flare System
There are many issues that associated with multi tip flare
system design. One of these issues is included the difficulties of
anticipated flare gas flow rates and flaring duration. Also, feed
composition and its temperature conditions to flaring system are
complex to specify. Moreover, flame height with respect to the
fence height should be considered in the design task. Furthermore, noise and radiation to the surrounding are so important in
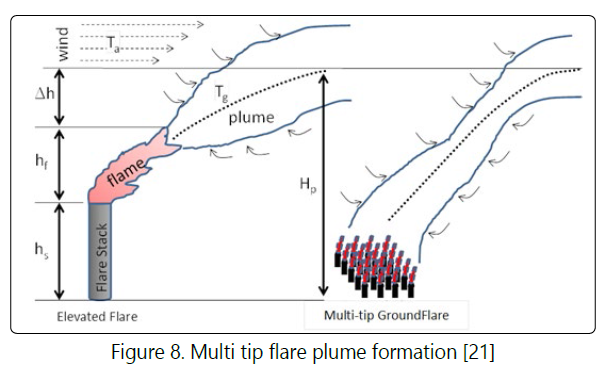
designing process. In multi-tip flares, large plume are created
from merging of all plumes of flare tips as shown in Figure 8.
Due to the large field of this kind of flare system, large flare plume formed, and the risk associated with high flame temperature and heat radiation, the flare performance quantification is difficult to perform. Therefore, simulations with suitable simulation package are used to quantify flare performance with different scenarios. Around the full multitip flare field wind fence. The main objectives of this fence are to protect workers and equip ment from thermal radiation and to protect flame shape form high wind speed that could affect the flame shape or may cause flame extinguishment.
An understanding of flare tip performance and wind effects on flame are required in order to estimate emissions from MTF. Also, more understanding with respect to the effects of the wind and tip geometry on flame are needed.
Also, knowledge the analysis of the transient flame, near tip mixing for hundreds of tips in large flare fields is wanted. To integrate these effects together, CFD modeling are used to simulate these systems efficiently.
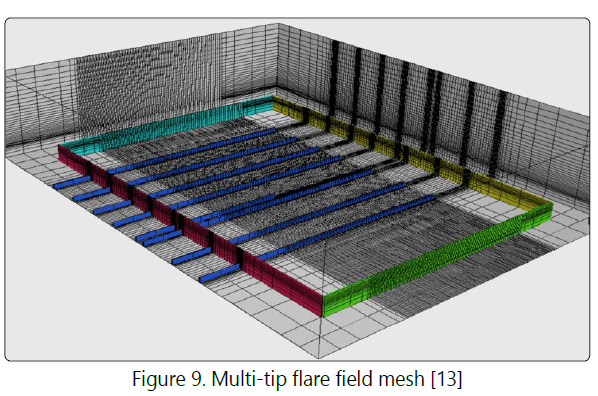
The multi-tip flare field domain size was 35, 35, and 25 meters for the length, width, and height respectively. Figure 9 presents the mesh of multi tip flare system that included 1.2 million cells in which local refinement near burner rows and tips was applied. To reduce computational time cost, rectangular orthogonal cells were used in all simulation cases. Two speeds for wind which are zero and 7 mph were considered for all simulations. Also, propane and ethylene gases were used as flare vent gases.
The CFD model that validated against single and three tips flare experimental data was used to simulate multi tip flare performance.
CFD fundamental models
C3d tool of CFD technique was used to obtain numerical
solutions for a 3D flare domain by simulating single tip and
three tips flare performance. Large Eddy Simulation (LES) as
the turbulence model was used. The governing equations for
the LES model assuming incompressible fluid flow are given
below [22]:
The continuity equation is given in equation 6:

where ρ is the gas density and u is the gas velocity vector.
The momentum equation is shown in equation 7:

with as the body forces, P as the pressure, and represented as the stress defined in equation 8:

The other governing equation to be solved is the energy equation (equation 10). The C3d form of this equation is introduced below:
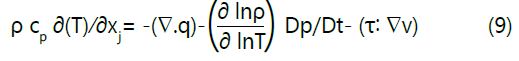
where Cp is the specific heat.
To resolve sub-filter scales for LES turbulence model, the Gaussian filter is used as shown in equation:

The following equations are used to model the kinetic energy dissipation on subgrid scales to molecular diffusion is present in equations (11) and (12):
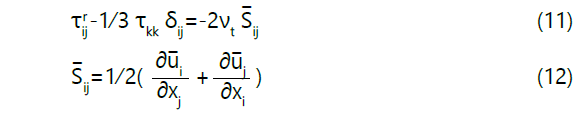
with as the stress tensor, as the rate-of-strain tensor, and as the turbulent eddy viscosity.
The eddy viscosity is approximated as the characteristic length scale times the velocity scale in most subgrid scale models as illustrated by the Smagorinsky-Lilly model:

The equilibrium assumption was applied between energy production and dissipation of small scales in this model.
The multi species conversation equations form is shown in equation (14)
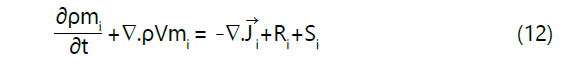
Where, mi is the mass fraction of species i, diffusion flux of species i, Ri is the mass creation or depletion by chemical reactions, and Si source of mass.
Results and Discussions
Soot Emission
During the ignition process, flare gas fed to the atmosphere
has insufficient momentum and time to completely mix with
sufficient oxygen to fully burn the flare gas which results in
excessive black carbon formation during the pyrolysis step, reaction 2 of the 4- step mechanism. Nearly all flares exhibit the
characteristic black smoke puff (unreacted black carbon) formed
by incomplete combustion which occurs during the transient
ignition process. Practical experience with gas flaring suggests
the transient ignition process lasts approximately 10-30 seconds. A conservative estimate for combustion efficiency during the
ignition process is approximately 50%. Given the number of flare
ignition events per year and using an average gas flow and an
average molecular weight derived from flare operating data
included in the paper, the estimate is a minimum of 700,000
kilograms of unreacted hydrocarbon emissions from these flares.
Single tip and three tips flares
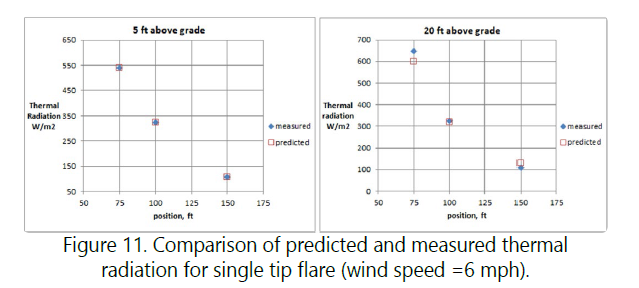
Figure 10 and Figure 11 show comparisons between
experimental observed thermal radiation data with those
predicted by C3d simulation for wind speed of 12 and 6
respectively. Figure 11 shows that there is very good
agreement between experimental and predicted thermal
radiation from single tip flare with wind speed of 6 mph. The
predicted data for wind velocity of 12 tends to under estimate
the present experimental data, this may be due to the fact
that the high wind speed effects on the flame shape is not
constant and hence the amount of radiated heat will be
changeable. For the same position with different velocities in
Figure 10 and Figure 11, the thermal radiation decreases with
wind speed increasing. This may due to that high wind speed
cools the flame temperature and hence reduces the temperature difference between flame temperature and the
measuring body temperature. Also, the amount of heat
release from the shorter flame is less than for longer flames.
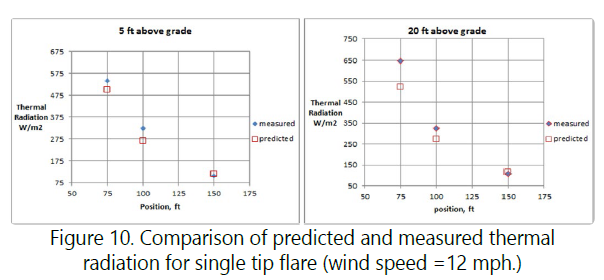
Figure 11, the thermal radiation decreases with wind speed increasing. This may due to that high wind speed cools the flame temperature and hence reduces the temperature difference between flame temperature and the measuring body temperature. Also, the amount of heat release from the shorter flame is less than for longer flames.
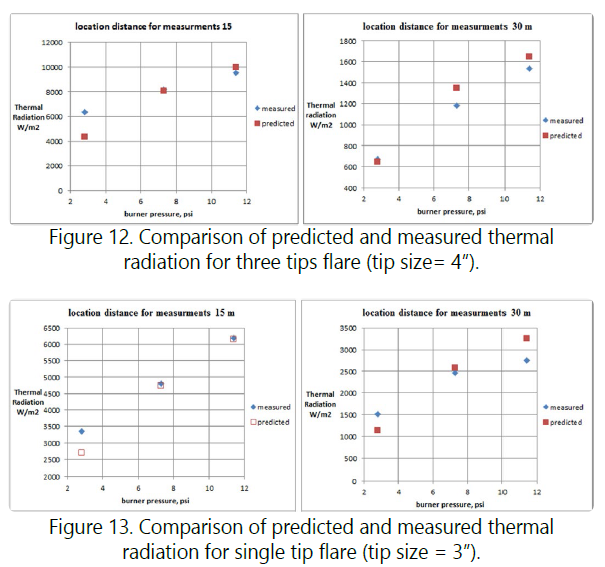
The measured and predicted heat radiation data for three tips flare are shown in Figure 12 and Figure 13 with tips size of 3 and 4 inches respectively, for different values of burner pressure. The trend of results indicates an increase in the thermal radiation with increasing burner pressure. This can be explained, as the pressure of burner increase, the amount of flared gas will be larger and this will increase the amount heat radiation. Figure 12 and Figure 13 show a good agreement between experimental and predicted data for thermal radiation.
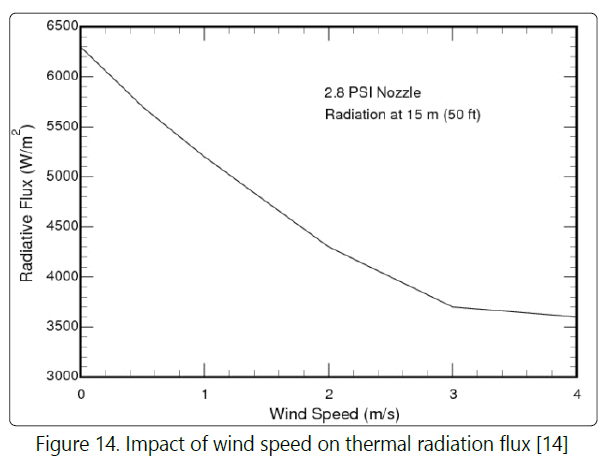
Thermal Radiation emission
The effect of wind speedon the heat radiation at burner
pressure of 2.8 psi and at distance of 50 foot is shown in
Figure 14. This figure indicates decrease in the thermal
radiation with increasing the wind velocity. This decreasing
could be a result of the reducing of flame temperature with
high wind velocity.
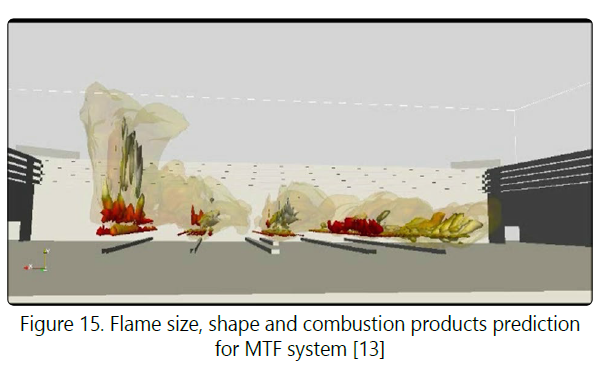
Multi tips Flare system
The predicted flame height and heat radiation for full
field of 405 burner tip is presented in Figure 15.Also, the
combustion products are shown in the same figure. The heat
radiation rate was found to be 61000 and 35000 watt/m2 on
the left and right walls respectively for the peak flow of flue
gases. Moreover, values of 6600 and 6600 watt/m2 on the left
and right walls respectively, when the flow is sustainable, are
obtained for the heat radiation. These cases were performed
with no wind effect.
Conclusions
Testing has been conducted for a single flare tip and a 3-flare tip system to measure the flame height and radiation flux when burning propane and Tulsa natural gas. These tests were conducted in a no-wind ambient condition as well as a 6-12 mile per hour wind conditions. The non-wind flame height for the single flare tip test was measured to be 48 - 53 ft high while the flame height in windy conditions was measured to be approximately 35 ft high. In the windy condition, the flame was also wider and had less radiation flux than the flame in non-wind conditions. The multi-tip tests were conducted to assess flame interaction and cross lighting of adjacent flare tip burners using a single pilot. The three tip tests showed s flame height essentially the same as the single flare tip test. This indicated the flames operated independently and did not merge into a single larger/taller flame. Testing showed that as the tip pressure increased from 2.8 psi to 11.4 psi the flame height increased as did the radiant flux (3344 W/ m2 to 6192 W/m2). This same behavior was observed for the larger 4" flare tip.
Given the test results, a detailed CFD model was developed and used to simulate the flare flame shape and height for various flare gas flow rates, tip pressure and size and ambient wind conditions. Predicted soot levels and radiant heat flux from the single and multiple flare tests were compared to the measured values to validate the model. Using the validated model, predictions for single, three, and multi tip flare systems were performed using an LES based CFD model. The validated CFD model was also used to simulate a large industrial multipoint ground flare system burning approximately 260 kg/s of flare gas. Using the validated flare model, the predicted radiation from a single and three flare tip showed good agreement with the measured data. In addition, simulation of a 400 multi-tipground flare system provided a reasonable estimate of the flame shape and flame height with the associated heat radiation profile on the surrounding wind fence and nearby equipment. Furthermore, at the maximum possible flare gas flow and at the sustained flare gas flow, the heat radiation predicted on the wind fence walls were estimated. Using the combustion simulations for this multipoint ground flare, assuming 50% combustion efficiency during a 10-30 second ignition period, we estimated approximately 700,000 kg/yr of unburned hydrocarbons may be emitted from an industrial scale multi-point ground flare.
References
- Elvidge CD, Zhizhin M, Baugh K, Hsu FC, Ghosh T. Methods for Global Survey of Natural Gas Flaring from Visible Infrared Imaging Radiometer Suite Data. Energies. 2016; 9(1): 14. doi: 10.3390/en9010014
- "The WorldBank," [Online]. Available: http://www.worldbank.org/en/ programs/gasflaringreduction#7.
- Enforcement-Alert, "EPA Enforcement Targets Flaring Efficiency Violoations," EPA-325-F-012-002, 2012.
- API Standard 521, Guide for Pressure-Relieving and Depressuring Systems, American Petroleum Institute, 2012.
- U.S. EPA. Integrated Science Assessment (ISA) for Particulate Matter (Final Report, Dec 2009). U.S. Environmental Protection Agency, Washington, DC, EPA/600/R-08/139F, 2009.
- Conrad BM, Johnson MR. Field Measurements of Black Carbon Yields from Gas Flaring. Environmental Science & Technology. 2017; 51(3): 1893- 1900. doi: 10.1021/acs.est.6b03690
- Johnson MR, Devillers RW, Thomson KA. A Generalized Sky-LOSA Method to Quantify Soot/ Black Carbon Emission Rates in Atmospheric Plumes of Gas Flares. Aerosol Science and Technology. 2013; 47(9): 1017-1029. doi: 10.1080/02786826.2013.809401
- McEwen JD, Johnson MR. Black carbon particulate matter emission factors for buoyancy-driven associated gas flares. J Air Waste Manag Assoc. 2012; 62(3): 307-321.
- Allen DT, Torres VM, Saldana FC. Carbon dioxide, methane and black carbon emissions from upstream oil and gas flaring in the United States. Chemical Engineering. 2016; 13: 119-123. doi: 10.1016/j.coche.2016.08.014
- Lack DA, Moosmüller H, McMeeking GR, Chakrabarty RK, Baumgardner D. Characterizing elemental, equivalent black, and refractory black carbon aerosol particles: a review of techniques, their limitations and uncertainties. Anal Bioanal Chem. 2014; 406(1): 99-122. doi: 10.1007/s00216-013-7402-3
- Weyant CL, Shepson PB, Subramanian R, Cambaliza MOL, Heimburger A, et al. Black Carbon Emissions from Associated Natural Gas Flaring. Environmental Science & Technology Black. 2016; 50(4): 2075-2081. doi: 10.1021/acs.est.5b04712
- Wang A, Lou HH, Chen D, Yu A, Dang W, et al. Combustion mechanism development and CFD simulation for the prediction of soot emission during flaring. Front. Chem. Sci. 2016; 10(4): 459-471.
- Smith JD, Jackson R, Suo-Antilla A, Smith S, Allen D. Achieving Environmental Compliance through Proper Destruction Efficiency of Low-Profile Multi-Tip Flare Systems. American Flame Research Committees- Industrial Combustion Symposium, Hyatt Regency Hotel Houston, Texas, September 2014.
- Smith J, Suo-Antilla A, Smith S, Modi J. Evaluation of the Air-Demand, Flame Height, and Radiation Load on the Wind Fence of a Low-Profile Flare Using ISIS-3D," in AFRC-JFRC 2007 Joint International Combustion Symposium, Marriott Waikoloa Beach Resort, Hawaii, 21 - 24 October 2007.
- Smith J, Suo-Antilla A, Philpott N, Smith S. Prediction and Measurement of Multi-Tip Flare Ignition. in American Flame Research Committees - International Pacific Rim Combustion Symposium, Advances in Combustion Technology: Improving the Environment and Energy Efficiency, Sheraton Maui, Hawaii, September 26-29, 2010.
- Smith J, Jackson R, Suo-Anttila A, Hefley K, Wade D, et al. Prediction and Measurement of Multi-Tip Flare Ignition in "American Flame Research Committees 2013 - Industrial Combustion Symposium, Safe and Responsible Development in the 21st Century, Sheraton Kauai, Hawaii, September 22-25, 2013.
- Smith J, Jackson R, Suo-Anttila A, Hefley K, Smith Z, et al. Radiation Effects on Surrounding Structures from Multi-Point Ground Flares, in AFRC 2015 Industrial Combustion Symposium, Historic Fort Douglas Officers Club University of Utah, Salt Lake City, Utah, September 9-11, 2015.
- Miller D. New Model for Predicting Thermal Radiation from Flares and High Pressure Jet Fires for Hydrogen and Syngas. Process Safety Progress. 2017; 35(3): 237-251. doi: 10.1002/prs.11867
- Smith J, Jackson R, Sreedharan V, Suo-Anttila A, Allen D, Smith S. Withstanding the Wind. Hydrocarbon Engineering. 2016; 21(10): 43-49.
- Said R, Garo A, Borghi R. Soot Formation Modeling for Turbulent Flames. Combustion and Flame. 1997; 108: 71-86. doi: 10.1016/S0010-2180(96)00068-5
- Smith JD, Suo-Anti A, Jackson R, Smith S. Prediction of Plume Formation and Dispersion from Gas Flares, in 2012 Annual American Flame Research Committee Meeting, Salt Lake City, Utah, September 5 - 7, 2012.
- Smith J, Adams B, Jackson R, Suo-Anttila A. Use of RANS vs LES Modelling for Industrial Gas-fired Combustion. Industrial Combustion. 2017.
