

Research Article
Manipulation of Different ratio Dependent approaches for Determination of Pravastatin in the presence of Pioglitazone in Pharmaceutical Preparation
Pharmaceutical Analytical Chemistry Department, Faculty of Pharmacy, Al-Azhar University, 11751 Nasr City, Cairo, Egypt
*Corresponding author: Ashraf Abdel-Fattah, Pharmaceutical Analytical Chemistry Department, Faculty of Pharmacy, Al-Azhar University, 11751 Nasr City, Cairo, Egypt, Tel: +201009408060, Email: ashraf.abdelfattah@hotmail.com
Received: February 16, 2018 Accepted: March 03, 2018 Published: March 09, 2018
Citation: El-Abasawi NM, Attia KAM, Aboserie AAM, Morshedy S, Abdel-Fattah A. Manipulation of Different ratio Dependent approaches for Determination of Pravastatin in the presence of Pioglitazone in Pharmaceutical Preparation. Madridge J Anal Sci Instrum. 2018; 3(1): 56-61. doi: 10.18689/mjai-1000111
Copyright: © 2018 The Author(s). This work is licensed under a Creative Commons Attribution 4.0 International License, which permits unrestricted use, distribution, and reproduction in any medium, provided the original work is properly cited.
Abstract
Objective: This study aimed to develop three simple UV spectrophotometric methods for determination of pravastatin sodium in the presence of pioglitazone hydrochloride without previous separation.
Methods: Manipulating ratio spectra were developed for the interested methods. The first method is the ratio subtraction using 16 μg/mL of pioglitazone hydrochloride as a divisor. The second method is an amplitude modulation using the normalized spectrum of pioglitazone hydrochloride as a divisor (1 μg/mL) the peak amplitudes of ratio spectra were measured at isoabsorptivity point 251.4 nm. The third method is the ratio difference using 14 μg/mL of pioglitazone hydrochloride as a divisor, where the peak amplitudes of ratio spectra were measured at 240 and 246.4 nm.
The results and discussion: The calibration curve is a linear over the concentration range of 2-20 μg/mL, the proposed methods were validated according to International Conference on Harmonization (ICH) guidelines and successfully applied for the determination of pravastatin sodium in the presence of pioglitazone hydrochloride in their combined pharmaceutical formulation, Pravazon® capsules with high sensitivity.
Conclusion: The proposed three methods are simple, rapid, economical, accurate and precise for determination of pravastatin sodium in the presence of pioglitazone hydrochloride without previous separation.
Keywords: Pravastatin Sodium; Pioglitazone Hydrochloride; Ratio Subtraction; Amplitude Modulation; Ratio Difference.
Introduction
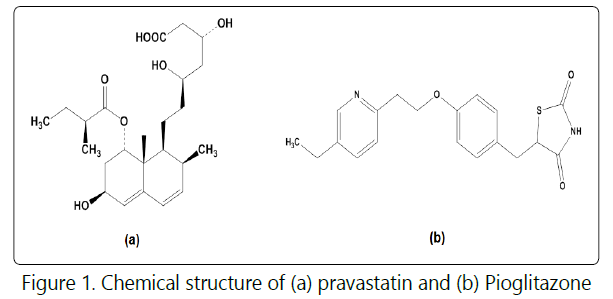
Pravastatin sodium (PRV), (Figure 1a), is sodium (3R,5R)-7-{(1S,2S,6S,8S,8aR)- 1,2,6,7,8,8a-hexahydro-6-hydroxy-2-methyl-8-[(S)-2-methylbutyryloxy]-1-naphthyl}- 3,5-dihydroxyheptanoate [1,2]. It is a selective and competitive inhibitor of 3-hydroxy-3- methylglutaryl -coenzyme A (HMG-CoA) reductase, the rate-limiting enzyme that converts HMG-CoA to mevalonate, a precursor of cholesterol [3]. PRV is a member of the class of statins, used to treat hypercholesterolemia and related conditions and to prevent cardiovascular disease. It increases the number of hepatic low density lipoprotein (LDL) receptors on the cell surface to enhance uptake and catabolism of LDL. Secondly, PRV inhibits hepatic synthesis of very low density lipoprotein (VLDL), which reduces the total number of VLDL and LDL particles [4].
Pioglitazone hydrochloride (PGZ), (Figure. 1b), is 5-[[4-[2-(5-Ethyl-2-pyridinyl) ethoxy]phenyl]methyl]-2,4-thiazolidinedione hydrochloride [5]. It is a thiazolidine-dione oral antidiabetic agent that improves insulin sensitivity. It is used in the treatment of type 2 diabetes mellitus. It is given orally as monotherapy, particularly in patients who are overweight and for whom metformin is contra-indicated or not tolerated [1].
Reviewing the literature on the new combination comprises PRV and PGZ in commercial dosage form, reveals only tworeported methods for simultaneous determination of both drugs [6].
The aim of this work is to develop simple, economic, rapid, sensitive, accurate and precise UV spectrophotometric methods for determination of PRV in the presence PGZ without previous separation steps. These methods include; Ratio subtraction; Amplitude modulation; Ratio difference.
Although this work is not advanced methods, its value arises from the lack of any published method for determination of PRV in the presence of PGZ in their new combination.
Instrument
Shimadzu UV/visible, double beam 1800 Spectrophotometer (Tokyo, Japan) with 1 cm matched quartz cells and UV Probe software (2.35 ver.).
Materials and Methods
Materials
Pure materials of PRV and PGZ were obtained as a gift
sample from Hi Pharm Company, El-Obour City, Egypt. Their
purity was found to be 99.52 and 99.61% for PRV and PGZ,
respectively, according to the reported methods [7, 8].
Pravazon® capsules containing 10 mg of each drug per capsule (B.No. APB180816), manufactured by Accent Pharma, India, marketed by UPHA Pharmaceutical Mfg, India. Methanol, analytical grade (El-Nasr Company, Egypt).
Preparation of Standard Solutions
Standard solutions (100 μg /mL) of PRV and PGZ were
prepared by transferring accurately weighed 10 mg of both
drugs into two separate 100-mL volumetric flasks, then
dissolved in methanol and completed to the mark with the
same solvent.
Construction of Calibration Curves (linearity)
Accurately measured aliquots equivalent to (0.20 _ 2.00
mL)of each drug were transferred from their standard
solutions (100 μg/mL) into two separate series of 10-mL
volumetric flasks and the volume of each flask was diluted up
to the mark with methanol, to reach the concentration range
of (2 _ 20 μg/mL). The absorption spectra of these solutions were measured in the range of 200 to 350 nm against
methanol as a blank.
Laboratory Prepared Mixtures
Accurate aliquots equivalent to (20-180 μg) PRV were transferred into a series of 10 ml volumetric flasks from its standard solution (100 μg/mL) and portion equivalent to (180 - 20 μg) of PGZ from its standard solution (100 μg/mL) were added to the same flasks and volumes were completed to mark with pure methanol and mixed well.
Ratio Subtraction Method [9]
The absorption spectra of the mixture were divided by the spectrum of 16 μg/mL of PGZ (divisor) to give ratio spectra, then the constant was determined from the plateau region, then subtracted from the ratio spectra, the original spectra of PRV was obtained after the multiplication of the obtained spectra by the spectrum of the divisor. The absorbance at 237 nm (λmax of PRV) was determined against the corresponding concentration of PRV to give the corresponding regression equation.
Amplitude Modulation Method [9]
The absorption spectra of the mixture were divided by the normalized spectrum of 1 μg/mL of PGZ (divisor) to give ratio spectra, then the constant was determined from the plateau region, then subtracted from the ratio spectra, the obtained spectra have the absorbance at isoabsorptive point equal to the corresponding concentration of PRV.
Ratio Difference Method [10]
The absorption spectra of the mixture were divided by the spectrum of 14μg/mL of PGZ. The peak amplitude of the ratio spectra was measured at 240 and 246.4 nm. The Calibration graphs relating the difference in the two selected wavelengths to the corresponding concentrations of PRV were constructed, and the corresponding regression equation was computed.
Application to Pharmaceutical Formulation
The content of ten capsules was accurately weighed and mixed well. An amount of the powder equivalent to 10 mg of PRV and 10 mg of PGZ was weighed, dissolved in methanol by shaking for about 30 min. The solution was filtered and transferred quantitatively into 100-mL volumetric flask. The filtration system was evaluated to ensure that the filter does not adsorb any of the drugs. The volume was then completed to the mark with methanol. Necessary dilutions were made to reach concentrations in the linearity range. The same procedures under the corresponding linearity were applied and the concentrations of PRV and PGZ were calculated from the corresponding regression equations.
Results and Discussion
Simple spectrophotometric methods were developed for the determination of PRV in the presence of PGZ without previous separation. The absorption spectra of the resulting solution of PRV and PGZ which containing (2-20 μg/mL) were measured and stored in the computer. Where, these absorption spectra of both drugs show severe overlapping and PGZ spectrum is extended more than PRV spectrum (Figure 2).

The therapeutic importance of ROS and PRO in its combined pharmaceutical preparation was behind our interest in the development of simple methods for determination of PRV in the presence of PGZ. The aim of the mixture is related to that PGZ exhibits a synergistic effect with statin drugs [11-13].
Ratio Subtraction Method
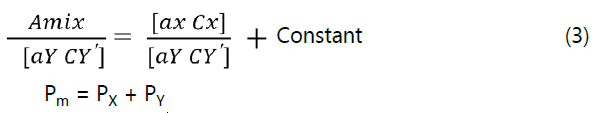
A mixture of two components X and Y with overlapping spectra can be resolved by ratio subtraction if the spectrum of component Y is extended more than X. Component X can be determined by dividing the spectrum of mixture by certain concentration of Y as a divisor (Y'). The will give a new curve that is represented by: X / Y' + constant.
If the consultant determined directly from the spectra and subtracted, the new spectrum multiplied by Y', the original spectrum of X is obtained. This can be summarized in the following equation:
(X+Y) / Y' = (X / Y') + (Y / Y') (1)
(X+Y) / Y' = (X / Y') + Constant (2)
By subtraction of the constant from equation (2):
X / Y' + Constant - Constant = X / Y' (3)
By multiplication of equation (3) by a divisor (Y'):
As a result, (X / Y') x Y' = X (4)
The constant can be determined directly from the spectrum (X+Y) / Y' by the straight line which is parallel to the wavelength axis in the region since Y is extended. The extended zero absorption spectrum of PGZ than zero absorption spectrum of PRV is necessary for application of this method as shown in (Figure 2). The absorption spectra of the mixture of PRV and PGZ were measured and recorded (Figure 3). The extension givesthe constant value when we use a certain concentration of PGZ (16μg/mL)as a divisor (Figure 4), this constant can simply be determined directly from the obtained ratio spectrum in the region of PGZ absorption spectrum extension, and by subtraction of this constant the new ratio spectrum (EZE spectrum / a divisor spectrum) was obtained. By multiplication of new ratio spectrum with a divisor spectrum (16μg/mL) the spectrum, which represent PRV without interference of PGZ will be obtained. Good linearity is obtained in the concentration range of (2 - 18μg/mL). The corresponding regression equation was computed.
Y = 0.0523 X + 0.007 r2 = 0.9998


Amplitude Modulation Method
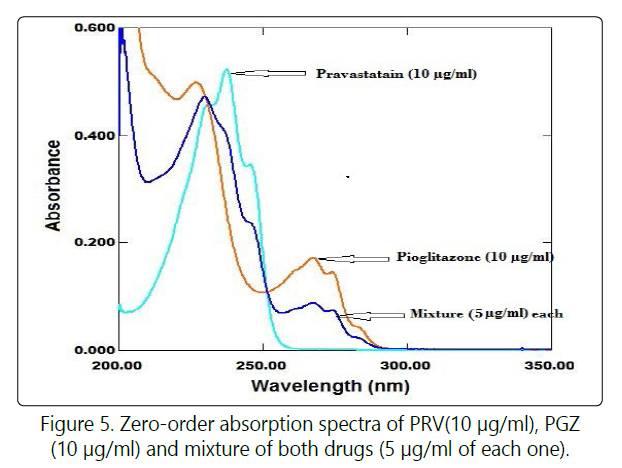
The spectra of PRV and PGZ showthe isoabsorptive point at zero spectrum and consequently retained as an isoabsorptive point at the ratio spectrum (Figure 5). The absorbance of the zero order absorption spectrum for mixture of X and Y at isoabsorptive point as follow:

By dividing Eq. (1) with a normalized spectrum of Y as a divisor to get ratio spectrum with isoabsorptive point (At the same wavelength of the zero order) so the following equation was obtained:

Where, (Pm) is the amplitude of the ratio spectrum of the mixture, (Px) is the amplitude of component X and (PY) is the amplitude of component Y. i.e. the recorded amplitude at the isoabsorptive point of the ratio spectrum is equal to the sum of amplitude corresponding to X and that of Y.
The amplitude representing the component Y (PY) was
the constant  and it can be measured directly from
the spectrum at the straight line that is parallel to the
wavelength axis in the region where Y spectrum is extended.
and it can be measured directly from
the spectrum at the straight line that is parallel to the
wavelength axis in the region where Y spectrum is extended.
Since, we use a normalized divisor of Y (1 μg/mL)
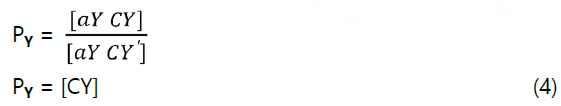
The recorded amplitude of the constant was modulated to concentration so it was representing the concentration of Y [CY], (CRecorded of Y). For determination of the amplitude of X in the mixture, If we subtract the measured value of the constant from that of the mixture at isoabsorptive point of the ratio spectrum Eq.(2);

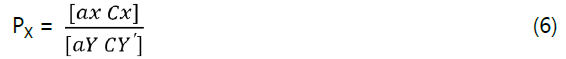
Consequently, at that isoabsorptive point aX = aY and normalized divisor of Y CY' = 1μg/mL


Therefore, This obtained amplitude of ratio spectrum was modulated to concentration and it was representing the concentration of X [CX], (CRecorded of X)
The corresponding concentration of X or Y could be calculated by using the following regression equation: CRecorded = Slope C + intercept Slope was found to be approximately one and intercept almost zero Where; CRecorded represents the recorded amplitudes corresponding to the concentrations of either X or Y that obtained from the ratio spectrum using a normalized spectrum of Y (1μg/mL) as a divisor and C represents the corresponding concentration of X or Y.
This method based on the same principle as the ratio subtraction method with simple modification step [use the normalized spectrum (1 μg/ml)as a divisor] (Figure 6).

Good linearity is obtained in the concentration range of (2- 18μg/mL). The corresponding regression equation was computed.
Ratio Difference Method
The method is based on the fact that, upon dividing the absorption spectrum of a compound by another spectrum of the same compound, a straight line of constant amplitude (parallel to the baseline) will be obtained. While upon dividing the absorption spectrum of a compound by the absorption spectrum of the other compound, a new spectrum (ratio spectrum) will be obtained.
The following step will simply be calculating the difference in absorbance between selected two points in ratio spectrum. Mathematically, it can be explained as follows:
In the ratio spectrum of a mixture of PRV (X) and PGZ (Y) divided by a divisor Y'.
P1 = P1x + K (1)
P2 = P2x + K (2)
Where, P1 and P2 are the amplitudes of mixture spectrum at λ1 and λ2 respectively, K is the constant resulting from Y /Y'
ΔPλ1-λ2 = P1- P2 = (P1x + K) - (P2x + K) = P1x - P2x (3)
So the component PGZ(Y) will be completely cancelled and the difference will represent the PRV (X) component only.
Validation of the Method
The proposed methodwastestedinthe linearity range, limit of detection (LOD), limit of quantification (LOQ), accuracy and precision according to International Conference on Harmonization (ICH) guidelines [14].
Linearity and Range
According to the described theory of ratio subtraction method, the linearity of PRV was determined at 237 nm.
According to the theory of amplitude modulation method, the linearity of PRV was determined by measuring the peak amplitudes of ratio spectra at the isoabsorptive point of 251.4 nm.
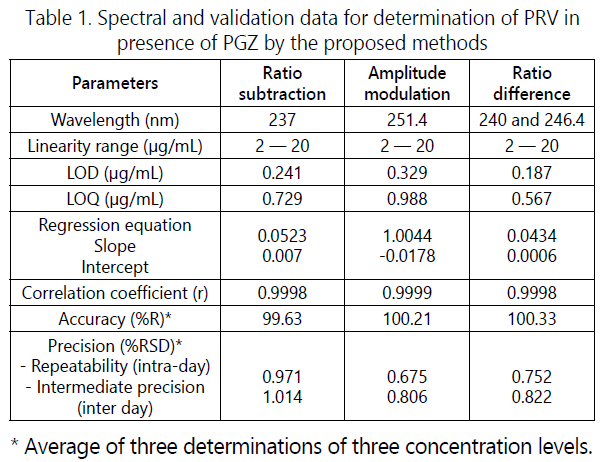
According to the experimental conditions of the ratio difference method, the calibration graphs for the method was constructed by plotting the differences of peaks amplitude at 240 and 246.4 nm against the concentration which related only to PRV.The calibration graphs for all proposed methods were rectilinear over the concentration range of 2-20 μg/mL for PRVwith high values of the correlation coefficient, the data is supplied in Table 1.
Limit of Detection (LOD) and Limit of Quantification (LOQ)
LOD and LOQ were calculated according to to ICH
guidelines [15] from the following equations:
LOD = 3.3 Sa / slope
LOQ = 10 Sa / slope
Where Sa is the residual standard deviation of a regression
line. LOD and LOQ values of PRV and PGZ for each method
were listed in Table 1.
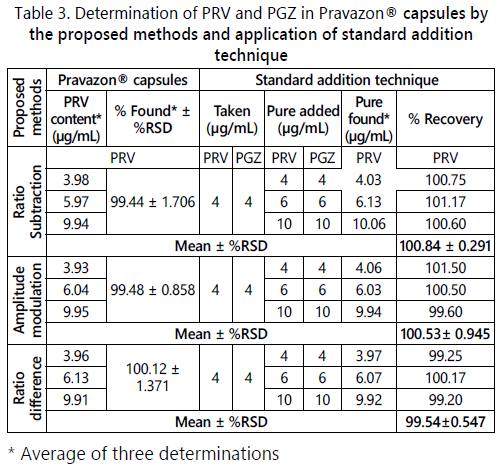
Selectivity: The selectivity of the methods was achieved by the analysis of different laboratory prepared mixtures of PRV and PGZ within the linearity range. Satisfactory results listed in Table 2, and the results of the standard addition technique Table 3 prove that the proposed methods can selectively analyze PRV without any interference from the other drug (PGZ) or the excipients.

Accuracy
Accuracy of the proposed methods, calculated as the mean percent recovery (%R), was assessed by applying the proposed procedures for triplicate determination of three concentration levels covering the specified range for each drug (6, 10 and 16 μg/mL). The concentrations were obtained from the corresponding regression equations and the mean percent recoveries, shown in Table 1, indicate the accuracy of the proposed methods. Accuracy of the methods was further assured by the use of the standard addition technique. It was performed by the addition of known amounts of pure PRV and PGZ to known concentrations of the pharmaceutical preparation and the resulting mixtures were assayed, and the results obtained were compared with the expected results (Table 3). The good recoveries of the pure added PRV suggested good accuracy of the proposed methods.
Precision
The precision of the proposed methods, calculated as percent relative standard deviation (%RSD) of the percent recoveries, was checked by applying the proposed procedures for triplicate determination of three concentration levels covering the specified range for each drug (6, 10 and 16 μg/ mL) in the same day (intra-day analysis) for repeatability and on three different days (inter day analysis) for intermediate precision. The results in Table 1 indicate precision of the method.
Application to Pharmaceutical Formulation
The proposed methods were applied for the determination of PRV and PGZ in their combined pharmaceutical formulation, Pravazon® capsules. Satisfactory results were obtained in good agreement with the label claim, and the results of the standard addition technique indicate no interference from excipients and additives (Table 3).
Statistical Analysis
Table 4 showed statistical comparison of the results obtained by the proposed methods and the reported method [6] in their pure form. The calculated t and F values were less than the theoretical ones indicating that; there was no significant difference between the proposed and the reported methods with respect to accuracy and precision.

Conclusion
Although these proposed methodsarenot advanced, but their values arise from the lack of any published method for determination of PRV in the presence of PGZ in their new combination.
The proposed methods are simple, rapid, economical, accurate and precise and can be used for determination of PRV in the presence of PGZ in pure form as well as in pharmaceutical dosage form without interference from excipient and no need for previous separation steps.
Acknowledgment
I am deeply thankful to ALLAH, by the grace of whom this work was realized. I wish to express my indebtedness and gratitude to staff members of the Analytical Chemistry Department for their valuable supervision, continuous guidance, and encouragement throughout the whole work.
Conflict of Interest
The authors declare no conflict of interest.
Reference
- Sweetman S. Martindale: The Complete Drug Reference. 37th ed. London. The Pharmaceutical Press. J Med Libr Assoc. 2012; 100(1): 75-76. doi: 10.3163/1536-5050.100.1.018
- Moffat AC, Osselton MD, Widdop B. Clarke's analysis of drugs and poisons. 4th ed. London. The Pharmaceutical Press. 2005.
- Lennernas H, Fager G. Pharmacodynamic and pharmacokinetics of the HMG-CoA reductase inhibitors. Similarities and differences. Clin Pharmacokinet. 1997; 32(5): 403-425. doi: 10.2165/00003088-199732050-00005
- Nissen S, Nicholls S, Sipahi I, Libby P, Raichlen JS, Ballantyne CM. Effect of very high-intensity statin therapy on regression of coronary atherosclerosis: the Asteroid trial. Preliminary Communication. 2006; 295(13): 1556-1565. doi: 10.1001/jama.295.13.jpc60002
- The Merck index. 14th ed. Whitehouse Station. 2006.
- Olemy A. Simultaneous UV Spectrophotometric Determination of Pravastatin Sodium and Pioglitazone Hydrochloride in Pharmaceutical Preparations. J Adv Pharm Res. 2017; 1(3): 143-149. doi: 10.21608/ APRH.2017.3359
- Balaji S, Katteboina S. Development of spectrophotometric method for determination of pravastatin sodium in bulk and tablet formulations. Int J Pharm Tech Res. 2009; 1 (4): 1017-1019.
- Ali MY, Swamy PV, Borgaonkar P, Raju SA. UV-spectrophotometric determination of pioglitazone in pharmaceutical dosage forms. Int J Chem Sci. 2008; 6(4): 2062-2065.
- Khalid AM, Mohamed WI, Ahmad AM, Ashraf A. Simple stability indicating ultraviolet spectroscopic methods for the estimation of ezetimibe in presence of its alkaline degradation product. ACAIJ. 2016; 16: 382-393.
- Khalid AM, Mohamed WI, Ahmad AM, Ashraf A. A comparative study of different approaches for stability indicating determination of tizanidine in presence of its oxidative degradation product. Int J Pharm Pharm Res Human. 2016; 5: 166-195. doi: 10.25166
- Tonker T, et al. Diabetes Care. 2010; 33: 1625-1628.
- Leonhardt W, et al. Atherosclerosis. 2008; 201: 155-162.
- Wei J, Ma C, Zhang Y, Li Y. Cell Biology International. 2007; 3: 451-458.
- ICH Q2(R1) Validation of Analytical procedures: Text and Methodology. Geneva. 2005.
