Research Article
Computational Fluid Dynamic Analysis of Flapping Wing of Micro Aerial Vehicle at Very Low Reynolds Numbers Turbulent Flow
1Department of Mechanical Engineering, Clemson University, Clemson, SC, USA
2Army Research Laboratory, Aberdeen, MD, USA
*Corresponding author: Abduljaleel Altememe, Department of Mechanical Engineering, Clemson University, Clemson, USA, E-mail: aalteme@clemson.edu
Received: May 10, 2019 Accepted: August 19, 2019 Published: August 27, 2019
Citation: Altememe A, Myers OJ, Hall A. Computational Fluid Dynamic Analysis of Flapping Wing of Micro Aerial Vehicle at Very Low Reynolds Numbers Turbulent Flow. Int J Aeronaut Aerosp Eng. 2019; 1(2): 68-75. doi: 10.18689/ijae-1000110
Copyright: © 2019 The Author(s). This work is licensed under a Creative Commons Attribution 4.0 International License, which permits unrestricted use, distribution, and reproduction in any medium, provided the original work is properly cited.
Abstract
This research presents the development of a bioinspired flapping flight system and a characterization of its performance when operating in turbulent airflow conditions. This system consists of a structure installed within wind tunnel for two dimensions and three dimensions of a Flapping Wing Micro Aerial Vehicles (FWMAV). Each airfoil or wing is able to deform into a classical flow pattern is the von Krmn vortex street that can form as fluid flows past an object. These vortices may induce vibrations in the object. This problem involves a fluid structure interaction (FSI) where the large deformation affects the flowpath. The exert load is predominately performed in the trailing edge of the airfoil or on the tip of the wing, and the reaction forces are generated by the feathers located at the leading edge. For this study, the focus presents a benchmark case of the NACA0012 and s1223 airfoils with the trailing edge flap design operating in a turbulent airflow. Finite element analysis (FEA) is used to model the flow field and the fluid-structure interactions using Direct Numerical Simulation. Additionally, the airfoils or wingsʼ aerodynamic performance is comparatively analyzed between time-dependent and FSI turbulence model. This paper discusses how these two air foils or wings, and time-dependent FSI turbulent flow simulation results can be developed to serve the flapping flight for unmanned aerial system.
Keywords: Computational fluid dynamics; Flapping flight system; Turbulent Flow; Reynolds Numbers.
Introduction
For some time, interest has peaked in methods that change the baseline, or nominal, configuration of air vehicles. Very early in the aeronautics industry it realized that such a capability could be highly advantageous. As early as World War II, fighters to carry on aircraft carriers were equipped with folding wings to increase their storage efficiency. Like birds, the capability to control the shape of the wing by folding is particularly important for small-scale micro aerial vehicles (MAV) to extend their flight envelope. MAVs are already proved to be valuable instruments in many research and industrial applications such as agriculture, parcel delivery, aerial inspection and mapping [1].
Still the predominant design strategy for most full-scale flight vehicles has been to determine a single configuration that yields satisfactory performance for all expected flight regimes. Of course, the resultant design is necessarily suboptimal since there are inherent design conflicts in this strategy. It is impossible to design a single configuration vehicle that is optimal for the conflicting requirements including small turning radius, increased payload, high speed, extended loiter time, long endurance... etc.
The relatively small number of reconfigurable flight vehicles that emerged during these early years can be attributed to the mechanical complexity of the actuation systems and to the mechanical complexity required to induce configuration change in full-scale aircraft. Thus, the advent of active materials ushered in a flurry of activity in the development of novel designs for morphing full scale (or near full scale unmanned) air vehicles that could provide more nearly optimal performance for a highly complex missions. These efforts included the DARPA sponsored Morphing Aircraft Structures (MAS) program. In addition, there were numerous other individual research studies sponsored by NASA, AFRL, and AFOSR. Industry and academia have been an integral part of these research efforts [2].
Therefore, development of Micro Air Vehicles (MAVs) and Unmanned Air Vehicles (UAVs) has been an active research area. These vehicles are able to conduct many important missions such as environmental monitoring, planetary exploration, and search and rescue operation in natural disasters. Under such low Reynolds number conditions, flow-fields are often shown complicated flow phenomenon (e.g., flow-fields involve separation, transition, and sometimes reattachment) so that aerodynamic performance of airfoils, which are generally utilized under high Reynolds number conditions, drastically degrades [3]. Therefore, it is important to understand the aerodynamic characteristics in low Reynolds number regime and many studies have been carried out.
While active materials allow for simpler solid state designs in principle, the realization of effective smart material actuators for full-scale aircraft has remained a difficult goal. At the root of many of the problems is the simple fact that active materials actuators do not yet have the authority to reconfigure nominally rigid aero structures. In other words, active material actuators generally do not have the authority to morph modifications of existing aircraft, which have been designed to optimize resistance to aerodynamic loads. In face of this fact, some research efforts have focused on the fundamental redesign of the underlying aero structure to be amenable to reconfiguration.
Kojima et al. [4] have studied the flowfields and aerodynamic characteristics of two airfoils NACA0002 and NACA0012 using three-dimensional implicit large-eddy simulation (3D-LES) and laminar-flow simulations.
Aerodynamic research at relevant Reynolds numbers has been severely limited. Experimental airfoil data has been published by Schmitz [5] and Althaus [6], among others, at chord Reynolds numbers as low as 20,000 to 30,000, but in terms of the nature of the viscous effects, this is considerably different from the range of interest below Re=10,000. This data also represents the extreme lower range of operation for many wind-tunnel facilities and inconsistencies are often apparent in the resulting data. Uranga et al. [7] and Galbraith et al. [8] have investigated the flow features around the SD7003 airfoil at an angle of attack of 4 using 3D-LES. For analysis of low Reynolds number flow, unsteady and high-accuracy simulations such as 3D-LES are preferable because it is required to accurate estimate the separation, transition, and reattachment.
Research into hovering flight at small physical scales has been dominated by studies of the hovering or near-hovering flight of insects and birds. The comprehensive work by Ellington [9] is an excellent example and provides significant insight into the mechanisms of micro-scale hovering flight in nature. Emphasis has typically been placed on the biomechanics of flight and the search for, and modelling of, unsteady aerodynamic mechanisms of high lift such as the clap and fling mechanism proposed by Weis-Fogh [10] or the unsteady wake mechanisms proposed by Rayner [11]. Common to all of these studies is a focus on inviscid aerodynamics, with, at most, simple accounting and estimates of viscous effects.
In the current study, we can summarize that the flapping airfoil is a special type of wing flapping which is inspired from the insect and bird in nature. The propulsive performance is one of the most important considerations for this kind of flapping wing. This paper is aimed at providing a fluid structure interaction synthesis on the Lift and drag characteristics of two airfoils then flapping wings at turbulent flow configuration based on the computational fluid analysis approach. Firstly, set up the FSI model of the flapping airfoils and wings are present. Secondly, the effect of flapping motion of the airfoils and wings on lift and drag forces is illustrated. Finally, the quantification effects of the trailing edge displacement and frequency on the lift and drag characteristics of the flapping wing can be obtained. The analysis results in this study will provide useful guidelines to design an effectively flapping flight system applying for the flapping wing micro aerial vehicle or unmanned aerial vehicle.

Computational Fluid Dynamics SIMULATION
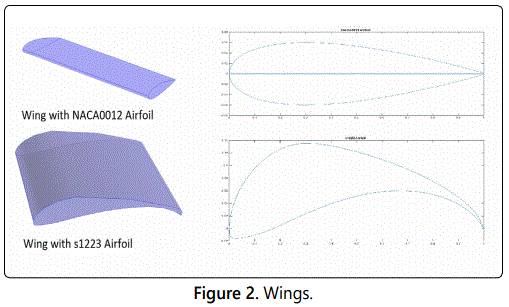
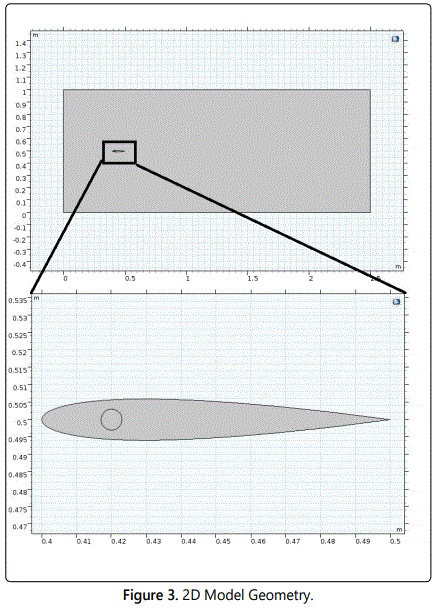
In this study, NACA0012 and s1223 were adopted as straight and curve airfoils, respectively. These airfoil shapes are shown in figure 2, respectively. The freestream Mach number M set to less than 0.3, the value at which compressibility can be ignored and computational efficiency can be improved. The Reynolds number Re was set to 23,000, which is the same as that in the previous experimental studies. The angles of attack were set to 0.0, 8.0, and 16.0 deg for computation, and note that turbulent flow computation is approximately 300 times more expensive than laminar computation. However, laminar computation is unable to treat turbulent transitions. First, we will go to describe the modeling and analysis process used to compare time-dependent air models to previously developed laminar simulation. The development of a time-varying wind model is the initial step in the construction of the flapping wing of UAV system. The flapping wing model have been based on a NACA0012, and s1223 designed in University of Illinois, Urbana Champaign, as there is a strong base of historical data available to confirm the results of the computational fluid dynamics CFD simulations. The wing have been initially designed with a chord of 10 cm and span 15 cm, from which all wing flaps has been selected due to data being available for lift and drag respectively as shown in figure 2. This model is implemented in the COMSOL Multiphysics environment. This software is chosen for its capabilities to solve computational fluid dynamics CFD, fluid-structure interactions FSI, optimization, piezoelectric transducers modeling, structural design and mechanisms, and simultaneously. However, the focus of this paper is orientated around the CFD and FSI capabilities. The important thing is to develop the system that measures the unsteady wing loadings being experienced during flapping process to determine the required payload effort to keep the UAV to its original flight path. To simulate the fluid structure interaction, need to install the physics for every steps of the structure in the simulation. Initially, simulations are performed using k–ε turbulence modeling under unsteady-state conditions in order to compare the results against laminar flow results. The simulations are performed at wind velocity 5 m/hr, angles of attack, and trailing edge deflections. So, the model geometry contain wing inside a wind tunnel as in figure 3 for more detail see reference [14]. The turbulent models generated by FEA model are presenting lift, and drag forces (L, and D) data that indicates that the boundary layer remains attached to the wing surface while at these angles of attack due to the flapping. From the historical data presented by Abbott et al. [15], boundary layer separation and wing stalling should begin around an angle of attack of 10. Consequently, because the flapping process, the results shows the separation vanish and we continue to resolve the cause of the variation. The CFD simulations have been set with a nominal speed of 2.23 m/s, giving a Reynolds number of 153000. Additionally, kε turbulence model parameters have been set to mimic the airflow characteristics within the wind tunnel used to generate the data in reference [15]; these parameters are defined by the following equations:


where U0 is the airspeed, IT is the turbulent intensity, on COMSOL Multiphysics the values of IT and Cμ are known, which on a low turbulence wind tunnel can be assumed to be 0.004 [16], LT is the turbulent length scale, and Cμ is the model constant for a flow through a pipe, given by Cμ to be 0.09. The classical formulation for turbulent length scale profiles in a fully developed channel flows gives a characteristic value at the core of LT, it is a measure of the size of the turbulent eddies that are not resolved. For fully developed channel flows, this parameter can be approximately derived as [17]:

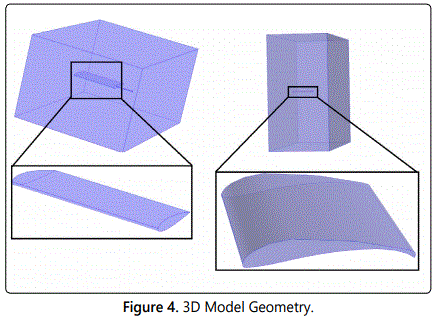
To simulate the fluid structure interaction, need to install the physics for every steps of the structure in the simulation. Therefore, the model geometry contains airfoil inside control volume as shown in figure 4, for more detail see [14].
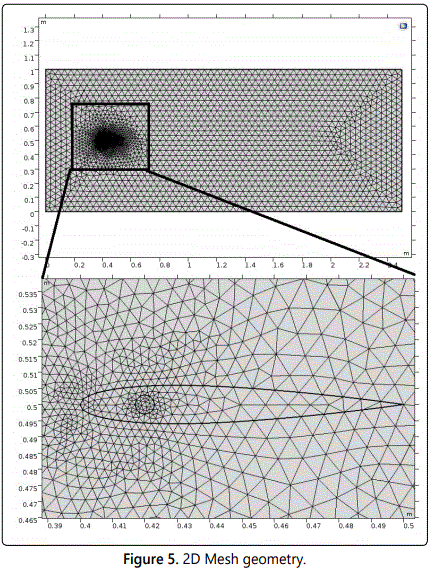
The dimension of channel domain is (1 m height and 2.5 m long). The structure of flapping airfoil is composed of a fixed Roller (circular domain) inside the airfoil with 0.003 m radius and the center depend on the airfoil located and shape here centered at (0.42, 0.5). The length of the airfoil chord is 0.1 m, both of airfoil and the roller made of elastic material as shown in figure 5.
For both airfoils s1223 and NACA0012 airfoil use the data file and the re scale to appropriate position. The air enter the wind tunnel as a parabolic velocity profile in the left side with mean velocity of 5 mile/hr (2.235 m/s) and assumed to be fully developed. Sometimes would require to increase the distance between the flapping wing structure and the channel inlet condition to prevent the effect of inlet velocity condition on the flow pattern before reaching the structure.


The turbulent length scale LT=0.007 × L where L is the height of the wind tunnel at the testing point; for this initial analysis the wind tunnel height has been defined as 1 m. This dimension is selected to ensure the simulations generate comparable data without risk of influence of the tunnel walls on the flow over the airfoil. In other hand the walls of the channel have been defined with slip condition for the fluid and far away from airfoil, thereby minimizing boundary layer development that may disturb the airflow around the airfoil profile.
The outflow condition set up in right side of the tunnel with zero pressure because is far away from the wing and there is no effect on the structure. Also, it is assumed there is no back flow in outflow to prevent the air from entering the domain through the boundary (Figures 3 and 4). Both of and the cylinder made of elastic material as in table 1.

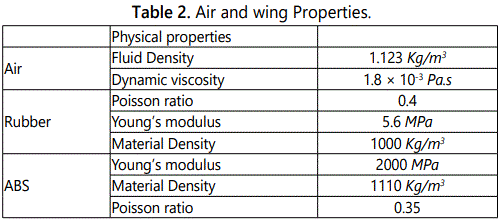
The outflow condition set up in right side of the tunnel with zero pressure because is far away from the wing and there is no effect on the structure. Also, it is assumed there is no backflow in outflow to prevent the air from entering the domain through the boundary. Set slip condition on the all sides of the tunnel boundaries for the fluid. The properties of flapping wing and the air are shown in table 2. In this paper we focus on fluid-structure interactions focuses on how the structural and fluid dynamics of and around a wing change with actuation frequency and airfoil flexibility. Through the development and analysis of a computational model of a two dimensional airfoil at Reynolds-Averaged Navier-Stokes (RANS) turbulent flow, we found that fluid forces do not dramatically change airfoils shape and thereby modify flight forces (i.e. the deformation in airfoil is dominated by the actuation of the airfoil structure, not the fluid loads imposed upon it). So, considering the fluid flow around the airfoils to be compressible, the equations used by the solver are Navier-Stokes equations as shown below:


Where, the velocity field components ufluid=(ufluid, vfluid) and displacement field components usolid=(usolid, vsolid). In general there is no a specific known analytically solution for the Navier-Stokes equations, but by using the vicinity of critical points in the flow to derive the local solutions. In other hand, the flow is characterized by low Reynolds number which is given by:

Mesh Geometry
Accuracy and solution time are two of the most critical concerns in computational fluid dynamics (CFD) simulation, and both are highly dependent on the characteristics of the mesh. Different types of meshing elements are needed to deliver optimal performance in resolving different geometries and flow regimes. But transitioning between varying types of elements has long been a challenge (Figure 6).
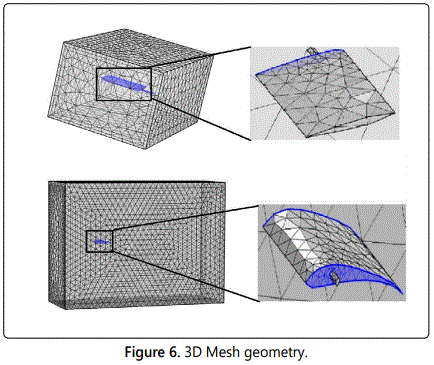
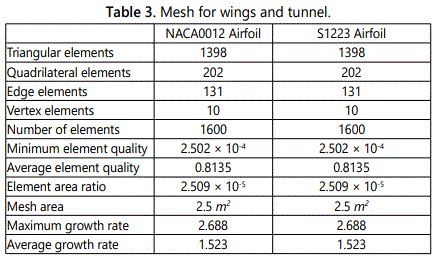
Meshing a geometry is an essential part of the simulation process, and can be crucial for obtaining the best results in the fastest manner. After creating a model in COMSOL Multiphysics, the mesh used for both airfoils and wings (NACA0012 airfoil wing and s1223 airfoil wing) to a Physics-controlled mesh with a normal element size. Lowering the minimum element size in mesh that is computationally taxing is to resolve the flow in the wake. To achieve this, additional mesh control entities are introduced in the geometry. These entities are advantageous to normal geometrical entities since they are removed whence they are completely meshed. A smoothing algorithm then smooths the mesh locally in order to minimize gradients in the mesh size. Also, it is easier to introduce a boundary layer mesh when the control entities are removed. Therefore the mesh needs to be quite fine on the airfoils or wing interface so that the fluid motion remains continuous. The mesh used in this model is plotted in figure 6. The mesh for every airfoil and the tunnel are shown in table 3.
Results and Discussion
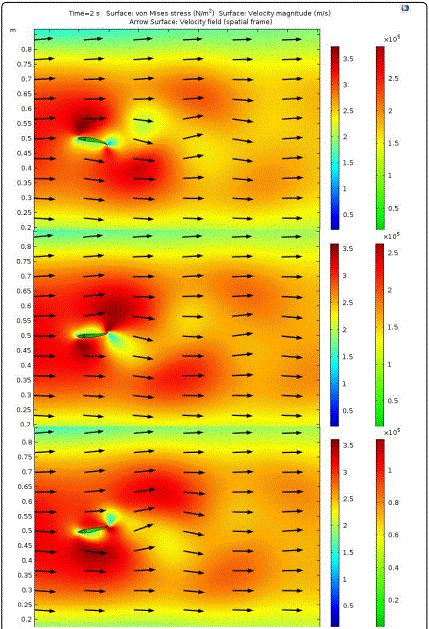
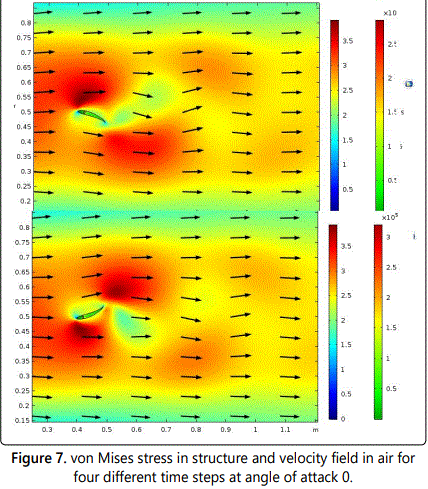
In the present analysis, and by using the Palmetto Cluster which is Clemsonʼs high performance computing research needs with 125 gb, 24 number of cores and 72 hours wall time, the simulation take 71 hours to finish the analyses. The velocity field is analyzed, in figure 7 shows the von Mises stress in the NACA0012 flapping airfoil and the velocity field for angle of attack 0 at four different times. From figure 7 it is noted that, at all steady flapping oscillating the wake retained approximately the same form. The wake contains lateral jets of fluid, alternating in direction, separated by one or more vortices or a shear layer (Figure 7). Each time the trailing edge changes direction, it sheds a stopstart vortex. As the trailing edge moves to the other side, a low pressure region develops in the posterior quarter of the body, sucking a bolus of fluid laterally. The bolus is shed off the trailing edge, stretching the stopstart vortex into an unstable shear layer, which eventually rolls up into two or more separate, same-sign vortices. This pattern was consistent at all speeds, even though the strength of the lateral jet increased at higher speeds (Figure 7). Also, Wake flow at different speeds and different phases (different colors) during the trailing edge beat cycle. Black arrows represent flow velocity magnitude and direction. Vorticity is shown in color in the background. The flow around the airfoil is in blue because the low fluid speeds. So, every separation point become a contact point that mean the flow cover the wing and the von Karman vortex street past the airfoils, which will be essentially deformed and influences those stream field. The only separation point can clearly be seen in the trailing edge as shown in figure 7. In addition, observed a vortex shedding around the trailing edge of both airfoils. The behavior of the flow for the pitching airfoil is presented in figure 7. During the down stroke phase the main vortex is shed from the surface and many smaller vortices are generated at the airfoil upper surface as shown in time step 4 in figure 7. As these structures intensities are reduced and carried downstream the airfoil the process of reattachment of the boundary layer starts as the flow is stabilizing close to 8° in the down stroke time step 3 in figure 7. The laminar separation bubble is then visible close to 3°, when the new pitching cycle begins in time step 2, and its intensity will be reduced until the flow is fully attached to the upper surface again at upstroke. The reattachment process is then completed, leading to the latter re circulation zone formation as the vortex shedding displays a periodic behavior. It is important to note the influence of the lower surface on the flow behavior during the down stroke. As the airfoil pitches down, not only the flow is detaching from the upper surface caused by the vortex shedding, yet the lower surface is acting, in the other direction, producing an upward force and hence reducing the lift. Since the airfoil is symmetric, both surfaces act on the aerodynamic forces generation. Due to its viscosity the fluid will bend around the airfoil as it sticks on the surface. The difference of speed on the fluid particles of the boundary layer leads to the creation of shear forces that attach the flow and force it to flap in the direction of the slower layer, which is close to the wall, hence the fluid try to wrap around the object. When the flow is reattached near down stroke, the upper surface again bends the air down in the trailing edge, as expected for a positive attitude incidence. In figure 8, shows the change in lift and drag forces for NACA0012 flapping airfoil. The change in pressure around the flapping wing produces a force Lift and Drag. These forces evaluated by the difference between the upper surface pressure and the lower surface pressure.
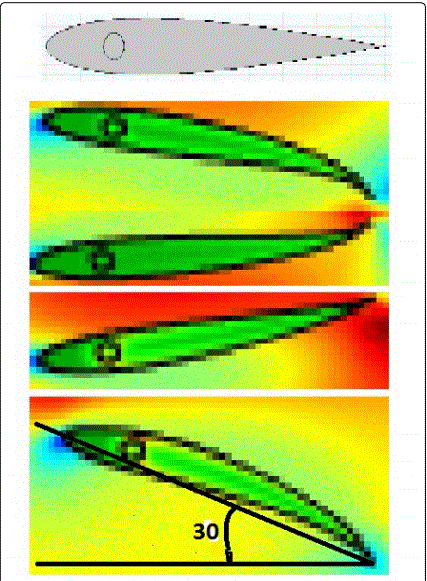
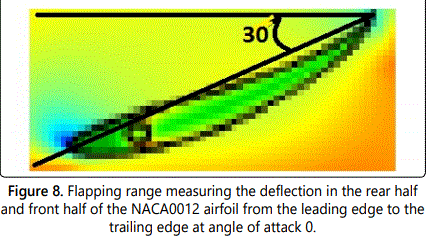
The NACA0012 flapping airfoil structure was unique in the deflection because the airfoil did not just flap straight up and down like the other s1223 airfoil. Figure 8 shows a flapping range plot of the top and bottom portions of the NACA0012 airfoil. Since the rear half of the airfoil beyond the fixed domain deflected more than front half of the airfoil, a twisting motion occurred in the flapping of the airfoil. Figure 8 shows deflection measurements taken on a flapping airfoil highlighting the difference in deflection across the airfoil section. The initial deflection in the rear half of the airfoil was 17.5 mm while the front half of the airfoil deflected only 6 mm. As flactuation increased, the rear half of the airfoil deflected more than the front half. Measuring the rear half and front half of the airfoil just prior to end of simulation yielded a total deflection of 50 mm and 10 mm, respectively. If the oscillating were able to continue increasing, than the twisting in the NACA0012 airfoil would also increase. This twisting phenomenon in the flapping airfoil was also helpful to produce thrust in the simulation of the flapping wing.
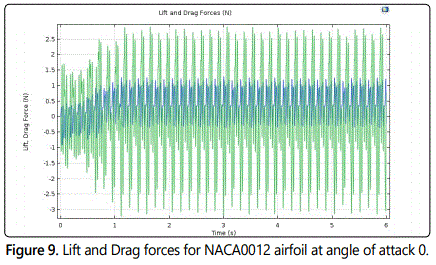
As shown in figure 9, the evolution of lift and drag forces for all time for NACA0012 airfoil at 0 deg angle of attack. At time (t=1 sec) the oscillation of NACA0012 airfoil are fully developed but s1223 airfoil there is no real results, this is a proof that s1223 airfoil design for laminar flow applications as shown in figure 10. In other hand the change in lift force larger than in drag force because the oscillating in y direction is larger than x-direction. Also, when angle of attack increase both drag and lift force increase.
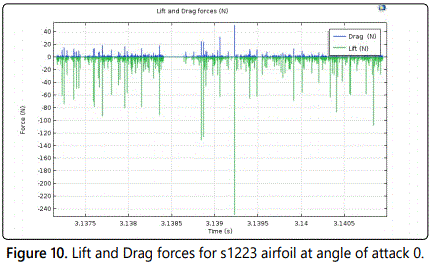
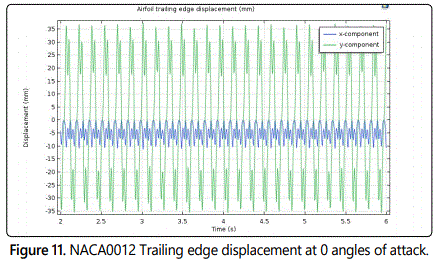
In figure 11 shows the oscillation magnitude of trailing edge for both directions x and y. for NACA0012 airfoil the xdisplacement oscillation about -10 mm around the average -5 mm and the difference in y displacement 2 mm with oscillation around 70 mm. The trailing edge oscillation in s1223 airfoil completely uncomprehended because the oscillation magnitude in x displacement and y displacement just streight line with magnitude 0 mm. The behavior of trailing edge oscillation in s1223 convex and this airfoil design for laminar flow applications.
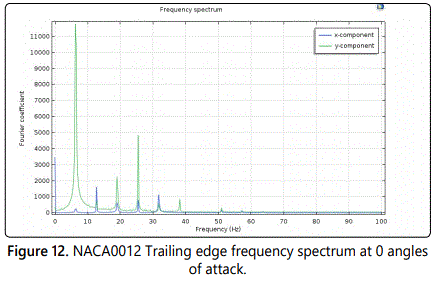
In addition, in figure 12 the main harmonic oscillation frequencies. The trailing edge frequency for the x displacement is 13 Hz but in y displacement is around 7 Hz in NACA0012 airfoil. In s1223 airfoil there is no results because uncomprehended behavior in turbulent flow.
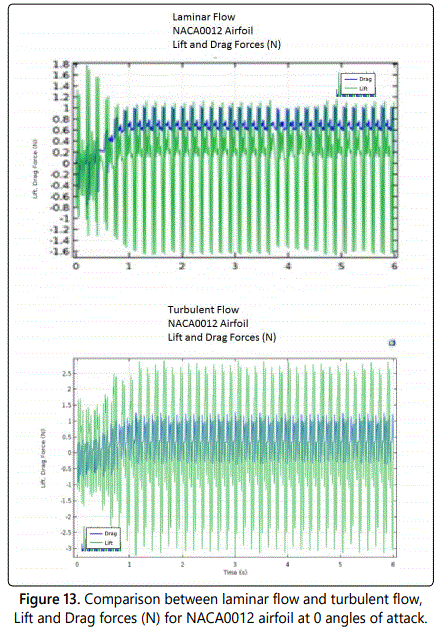
From the analysis of the lift force and drag force hysteresis loops for the laminar flow results in comparison with turbulent flow results, as shown respectively by figures 12 and 13, it is possible to observe that the laminar flow results can be addressed with good agreement turbulent flow results for both upstroke and downstroke behavior . Although the laminar flow results less than turbulent flow, the drag force in laminar flow matched the drag force in turbulent flow results for low Reynolds number regime, as shown by figure 12. The surge of lift force encountered seen in both laminar flow and turbulent flow results cannot be accounted by the flapping airfoil model as well, as in turbulent flow, it is a consequence of the vortex residence at the airfoil upper surface at the end of upstroke phase, presenting a high energy profile due to flow acceleration and vorticity. As discussed, the downstroke phase has a highly rotational behavior as well, which is not accounted by the laminar flow; hence the hysteresis loops for the flapping airfoil cannot model the flow, differing from the laminar flow and turbulent flow results. The comparison between the laminar flow and turbulent flow computations, the trailing edge displacement for both laminar and turbulent flow shows good agreement in both results as shown in figure 14. The results of trailing edge displacement from turbulent flow, shows that the model can serve as an important tool for the unsteady analysis, rendering fair results with less computational effort than turbulent flow models, for instance. Both cases displayed misleading results in a minor extent, which is expected due to the two dimensional approach and the material used in this model.

Conclusion
A preliminary flapping wing for unmmand air vehicle model has been developed using an approach based on the Reynolds Averaged Navier-Stokes equations (RANS) was applied, where the closure problem was solved by using a time-dependent k–ε turbulence model in two dimensional and three dimensional, where the wind speed flow inter the channel from right side and becomes a fully developed flow. The first objective of this paper was to present the preliminary results of a numerical study of the time-varying simulations performed are shown to be closely correlated to the laminar flow simulations developed previously but in three dimensional just reach the steady state. These simulations enable the progression of the turbulent air flow model to be extended to allow flapping wing to be improved. The basic sinusoidal wave load process model has been implemented to create multiple velocity magnitude jet flow over a period of 6 seconds. The simulations performed include several flapping beats within this time frame of which the data at each time step closely follow the data gathered from the laminar flow and time-varying turbulence flow models. The second objective was to assess the effect on turbulent mixing of a grid formed by traingular elements with different mesh sizes. A comparison between the numerical results with the change in grid size demonstrated that the lowering the minimum element size in mesh that is computationally taxing. Further research will be addressed to extend the 3D case analysis based on the RANS.
References
- Floreano D, Wood RJ. Science, technology and the future of small autonomous drones. Nature. 2015; 521: 460-466.
- Lissaman PBS. Low-Reynolds-number airfoils. Ann Rev Fluid Mech. 1983; 15: 223-239. doi: 10.1146/annurev.fl.15.010183.001255
- Kojima R, Nonomura T, Oyama A, Fujii K. Large-Eddy Simulation of LowReynolds-Number Flow Over Thick and Thin NACA Airfoils. Journal of Aircraft. 2013; 50(1).
- Schmitz FW. Aerodynamics of the Model Airplane: Airfoil measurements. RSIC-721, Redstone Scientific Information Center, Redstone Arsenal, Alabama; 1967.
- Althaus D. Profile polars for the model flight. Band 2, Neckar-Verlag, GmbH. 1980.
- Uranga A, Persson P -O, Drela M, Peraire J. Implicit Large Eddy Simulation of transition to turbulence at low Reynolds numbers using a Discontinuous Galerkin method. International Journal for Numerical Methods in Engineering. 2011; 87(1-5): 232-261. doi: 10.1002/nme.3036
- Galbraith MC, Visbal MR. Implicit Large Eddy Simulation of Low-ReynoldsNumber Transitional Flow Past SD7003 Airfoil. 40th Fluid Dynamics Conference and Exhibit, Chicago, Illinois, AIAA 2010-4737. 2010.
- Ellington CP. The Aerodynamics of Hovering Insect Flight. Philosophical Transactions of the Royal Society of London, Series B. 1984; 305: 1-181.
- Weis-Fogh T. Quick Estimates of Flight Fitness in Hovering Animals, Including Novel Mechanisms for Lift Production. Journal of Experimental Biology. 1973; 59: 169-230.
- Rayner JMV. A Vortex Theory of Animal Flight. Part 1. The Vortex Wake of a Hovering Animal. Journal of Fluid Mechanics. 1979; 91(4): 697-730.
- Eleni DC, Athanasios TI, Dionissios MP. Evaluation of the turbulence models for the simulation of the flow over a National Advisory Committee for Aeronautics (NACA) 0012 airfoil. Journal of Mechanical Engineering Research. 2012; 4(3): 100-111. doi: 10.5897/JMER11.074
- Hanjalic K, Launder B. A Reynolds stress model of turbulence and its application to thin shear flows. Journal of Fluid Mechanics. 1972; 52(4): 609-638. doi: 10.1017/S002211207200268X
- Turek S, Hron J. Proposal for numerical benchmarking of fluid-structure interaction between an elastic object and laminar incompressible flow. In: Bungartz HJ, Schäfer M (eds). Fluid-structure interaction. Springer publisher; 2006; 53: 371–385.
- Abbott IH, Doenhoff AEV. Theory of Wing Sections. Dover Publications, New York. 1959.
- Nader G, Dos Santos C, Jabardo P, Cardoso M, Taira N, Pereira M. Characterization of low turbulence wind tunnel. In Proceedings of XVIII IMEKO World Congress Metrology for a Sustainable Development, Rio De Janeiro, Brazil. 2006: 17-22.
- Freels JD, Bodey IT, Arimilli RV, Curtis FG, Ekici K, Jain PK. Preliminary Multiphysics Analyses of HFIR LEU Fuel Conversion using COMSOL. ORNL/TM-2011/07, Oak Ridge National Laboratory. 2011.

